E9-6275. Performance Specification 16 for Predictive Emissions Monitoring Systems and Amendments to Testing and Monitoring Provisions
-
Start Preamble
AGENCY:
Environmental Protection Agency (EPA).
ACTION:
Final rule.
SUMMARY:
EPA is taking final action to promulgate Performance Specification (PS) 16 for predictive emissions monitoring systems (PEMS). Performance Specification 16 provides testing requirements for assessing the acceptability of PEMS when they are initially installed. Currently, there are no Federal rules requiring the use of PEMS; however, some sources have obtained Administrator approval to use PEMS as alternatives to continuous emissions monitoring systems (CEMS). Other sources may desire to use PEMS in cases where initial and operational costs are less than CEMS and process optimization for emissions control may be desirable. Performance Specification 16 will apply to any PEMS required in future rules in 40 CFR Parts 60, 61, or 63, and in cases where a source petitions the Administrator and receives approval to use a PEMS in lieu of another emissions monitoring system required under the regulation. We are also finalizing minor technical amendments.
DATES:
This final rule is effective on April 24, 2009.
ADDRESSES:
EPA has established a docket for this action under Docket ID No. EPA-HQ-OAR-2003-0074. All documents in the docket are listed on the http://www.regulations.gov Web site. Although listed in the index, some information is not publicly available, e.g., CBI or other information whose disclosure is restricted by statute. Certain other material, such as copyrighted material, is not placed on the Internet and will be publicly available only in hard copy form. Publicly available docket materials are available either electronically through http://www.regulations.gov or in hard copy at the Performance Specification 16 for Predictive Emission Monitoring Systems Docket, Docket ID No. EPA-OAR-2003-0074, EPA Docket Center, EPA/DC, EPA West, Room 3334, 1301 Constitution Ave., NW., Washington, DC. This Docket Facility is open from 8:30 a.m. to 4:30 p.m. Monday through Friday excluding legal holidays. The docket telephone number is (202) 566-1742. The Public Reading Room is open from 8:30 a.m. to 4:30 p.m., Monday through Friday, excluding legal holidays. The telephone number for the Public Reading Room is (202) 566-1744.
Start Further InfoFOR FURTHER INFORMATION CONTACT:
Mr. Foston Curtis, Air Quality Assessment Division, Office of Air Quality Planning and Standards (E143-02), Environmental Protection Agency, Research Triangle Park, North Carolina 27711; telephone number (919) 541-1063; fax number (919) 541-0516; e-mail address: curtis.foston@epa.gov.
End Further Info End Preamble Start Supplemental InformationSUPPLEMENTARY INFORMATION:
Table of Contents
I. Does This Action Apply to Me?
II. Where Can I Obtain a Copy of This Action?
III. Background
IV. This Action
A. PS-16
B. Method 24 of Appendix A-7 of Part 60
C. Performance Specification 11 of Appendix B of Part 60
D. Procedures 1 and 2 of Appendix F of Part 60
E. Method 303 of Appendix A of Part 63
V. Public Comments on the Proposed Rule
A. Parameter Operating Level Terminology
B. PS-16 Applicability to Market-Based Programs
C. PS-16 and the Older Draft Performance Specifications on the EPA Web site
D. PEMS Relative Accuracy Stringency vs CEMS Stringency
E. Alternative Limits for Low Emitters
F. Statistical Tests
G. Use of Portable Analyzers for the Relative Accuracy Audit
H. Potential Overlap Between PS-16 and PS-17
I. Reduced Relative Accuracy Audit Frequency for Good Performance
VI. Judicial Review
VII. Statutory and Executive Order Reviews
A. Executive Order 12866: Regulatory Planning and Review
B. Paperwork Reduction Act
C. Regulatory Flexibility Act
D. Unfunded Mandates Reform Act
E. Executive Order 13132: Federalism
F. Executive Order 13175: Consultation and Coordination with Indian Tribal Governments
G. Executive Order 13045: Protection of Children from Environmental Health Risks and Safety Risks
H. Executive Order 13211: Actions that Significantly Affect Energy Supply, Distribution, or Use
I. National Technology Transfer and Advancement Act
J. Executive Order 12898: Federal Actions to Address Environmental Justice in Minority Populations and Low-Income Populations
K. Congressional Review Act
I. Does This Action Apply to Me?
Predictive emission monitoring systems are not currently required in any Federal rule. However, they may be used under certain New Source Performance Standards (NSPS) to predict nitrogen oxides emissions from small industrial, commercial, and institutional steam generating units. In some cases, PEMS have been approved as alternatives to CEMS for the initial 30-day compliance test at these facilities. Various State and Local regulations are incorporating PEMS as an emissions monitoring tool. The major entities that are potentially affected by Performance Specification 16 and the amendments to the subparts are included in the following tables. Performance Specification 16 will neither apply to existing PEMS nor those covered under Subpart E of 40 CFR part 75.
Regulated Entities. Categories and entities potentially affected include the following: Start Printed Page 12576
Table 1—Major Entities Potentially Affected by This Action: Performance Specification 16
Category NAICSa Examples of regulated entities Industry 333611 Stationary Gas Turbines. Industry 332410 Industrial, Commercial, Institutional Steam Generating Units. a North American Industry classification system. Table 2—Major Entities Potentially Affected by This Action: Amendments to Performance Specification 11 and Procedures 1 and 2, Appendix F, part 60
Category NAICSa Examples of regulated entities Industry 333298 Portland Cement Manufacturing. Industry 562211 Hazardous Waste Incinerators. a North American Industry Classsification System. Table 3—Major entities Potentially Affected by This Action: Amendments to Method 24, Appendix a, Part 60
Category NAICSa Examples of regulated entities Industry 326211 Rubber Tire Manufacturing. Industry 323111 Flexible Vinyl and Urethane Coating and Printing. Industry 334613 Magnetic Tape Coating Facilities. Industry 326199 Surface Coating of Plastic Parts for Business Machines. Industry 332812 Polymeric Coating of Supporting Substrates Facilities. Industry 337124 Surface Coating of Metal Furniture. Industry 336111 Automobile and Light Duty Truck Surface Coating. Industry 323111 Graphic Arts Industry: Publication Rotogravure Printing. Industry 322222 Pressure Sensitive Tape and Label Surface Coating Operations. Industry 421620 Industrial Surface Coating: Large Appliances. Industry 335931 Metal Coil Surface Coating. Industry 332812 Beverage Can Surface Coating. Industry 33641 Aerospace. Industry Boat and Ship Manufacturing and Repair Surface Coating. Industry Fabric Printing, Coating, and Dyeing. Industry Leather Finishing. Industry Miscellaneous Coating Manufacturing. Industry Miscellaneous Metal Parts and Products. Industry Paper and Other Web Surface Coating. Industry Plastic Parts Surface Coating. Industry Printing and Publishing Surface Coating. Industry Wood Building Products. Industry Wood Furniture. a North American Industry classificatiion System. Table 4—Major Entities Potentially Affected by This Action: Amendment to Method 303, Appendix A, Part 63
Category NAICSa Examples of regulated entities Industry 33111111 Coke Ovens. a North American Industry classsification System. These tables are not intended to be exhaustive, but rather to provide a guide for readers regarding entities likely to be affected by these actions. These tables list examples of the types of entities EPA is now aware could potentially be affected by these final actions. Other types of entities not listed could also be affected. If you have any questions regarding the applicability of this action to a particular entity, consult the person listed in the preceding FOR FURTHER INFORMATION CONTACT section. Start Printed Page 12577
II. Where Can I Obtain a Copy of This Action?
In addition to being available in the docket, an electronic copy of this rule will also be available on the Worldwide Web (www) through the Technology Transfer Network (TTN). Following the Administrator's signature, a copy of the final rule will be placed on the TTN's policy and guidance page for newly proposed or promulgated rules at http://www.epa.gov/ttn/oarpg. The TTN provides information and technology exchange in various areas of air pollution control.
III. Background
Performance Specification 16 and the amendments to PS-11, Procedures 1 and 2, Method 24, and Method 303 were proposed in the Federal Register on August 8, 2005 with a public comment period that ended October 7, 2005. A public commenter asked that the comment period be reopened to allow for additional time to prepare their response since they were a leading vendor of PEMS and were significantly impacted by the rule. We reopened the comment period for two weeks, from November 2-16, 2005. A total of 42 comment letters were received on the proposed rule. Most comment letters pertained to PS-16 and contained multiple comments. We have compiled and responded to the public comments and made appropriate changes to the rule based on the comments.
IV. This Action
A. PS-16
This action finalizes PS-16 for PEMS. This performance specification was originally proposed by EPA on August 8, 2005 (70 FR 45608). Performance Specification 16 establishes procedures that must be used to determine whether a PEMS is acceptable for use in demonstrating compliance with applicable requirements. Predictive emission monitoring systems predict source emissions indirectly using process parameters instead of measuring them directly.
Additionally, the following amendments are made to the noted testing and monitoring provisions.
B. Method 24 of Appendix A-7 of Part 60
Method 24, part 60, Appendix A-7 is used to determine the contents and properties of surface coatings under NSPS applications. Method 24 currently references ASTM D2369 as the method for determining volatiles content. The American Society for Testing and Materials has recommended that ASTM D6419 be allowed as an alternative to D2369 in this case. We have amended Method 24 to cite this optional method.
C. Performance Specification 11 of Appendix B of Part 60
The publication on January 12, 2004 of PS-11 for Appendix B and Procedure 2 for part 60, Appendix F contained technical and typographical errors and unclear instructions. We have revised the definition of confidence interval half range to clarify the language, replacing the word “pairs” with “sets” to avoid possible confusion regarding the use of paired sampling trains, corrected errors in Equations 11-22, 11-27, and 11-37, corrected the procedures in paragraphs (4) and (5) of section 12.3 for determining confidence and tolerance interval half ranges for the exponential and power correlation models, and added a note following paragraph (5)(v) concerning the application of correlation equations to calculate particulate matter (PM) concentrations using the response data from an operating PM CEMS. We have also renumbered some equations and references for clarification, consistency, and accuracy.
D. Procedures 1 and 2 of Appendix F of Part 60
In Procedure 1 of Appendix F of part 60, we revised obsolete language that describes the standard reference material that is required, and in Procedure 2, we added a needed equation for calculating an absolute correlation audit based on the applicable standard.
E. Method 303 of Appendix A of Part 63
In Method 303 of Appendix A to part 63, a statement on varying the time of day runs are taken that was deleted by mistake in a recent amendment of the method has been added.
V. Public Comments on the Proposed Rule
A more detailed summary of the public comments and our responses can be found in the Summary of Public Comments and Responses document, which is available from several sources (see ADDRESSES section). The major public comments are summarized by subject as follows:
A. Parameter Operating Level Terminology
Several commenters suggested we revise the key parameter operating level used for the relative accuracy (RA) test from “normal” to “mid.” It was noted that some units normally operate in the high or low levels and that a revised listing of mid level would ensure that the intended three levels would be evaluated. We agree with the commenters and changed the reference from “normal” to “mid.”
B. PS-16 Applicability to Market-Based Programs
Several commenters objected to applying PS-16 to PEMS that are used in a market-based program. They noted that market-based PEMS are already covered in Subpart E of 40 CFR part 75 and those requirements are different from proposed PS-16. This was deemed confusing from an applicability standpoint, especially for those PEMS that have already been approved under part 75. Other commenters stated that they did not understand why performance specifications for market-based monitoring were being added to 40 CFR part 60 since part 60 does not address marketing regulations. Some commenters asked whether PS-16 would apply to PEMS already in use.
We have dropped the proposed applicability of PS-16 to market-based PEMS and agree that part 75 is the better place to address market-based PEMS. Requirements for PEMS used in the part 75 market-based program are already addressed in Subpart E of part 75, and we do not believe the more stringent requirements given there for market-based PEMS are warranted for compliance monitoring under 40 CFR parts 60, 61, and 63. We note in the final rule that PS-16 applies only to PEMS that are installed after the effective date of today's action and to those used to comply with requirements in 40 CFR parts 60, 61, or 63.
C. PS-16 and the Older Draft Performance Specifications on the EPA Web Site
A number of commenters asked that the draft “Example Specifications and Test Procedures for Predictive Emission Monitoring Systems” on the EPA Web site be adopted as PS-16 instead of the proposed provisions. They note that these specifications have been used in the past to approve prospective PEMS and felt the same guidelines should be used in the future. One commenter thought a departure from the draft requirements would result in a demise in PEMS use due to the increased costs of initial certification and ongoing maintenance.
The “Example Specifications and Test Procedures for Predictive Emission Monitoring Systems” was a guidance document to give PEMS users and regulators a general idea of what could be expected of PEMS in light of the limited performance data available at Start Printed Page 12578that time. It was primarily based on the existing requirements in PS-2 for CEMS and not on extensive research. The document was offered on the EMC Web site until the Agency could develop and finalize PS-16. Since then, we have acquired relative accuracy test audit (RATA) data from a number of PEMS over time, and our understanding of their capabilities has increased. This data is presented in the docket and gives a better indication of PEMS performance than what is reflected in the guidance document (see EPA-OAR-2003-0074-0002, 0003, and 0004 docket entries). This data confirms that the performance levels set in PS-16 are achievable by the vast majority of PEMS in the data pool and are more reflective of the technology's capabilities. We disagree with the commenter that the new requirements in PS-16 will result in the demise of PEMS due to increased cost for initial certification and ongoing maintenance.
D. PEMS Relative Accuracy Stringency vs. CEMS Stringency
Some commenters objected to the 10 percent relative accuracy limit for PEMS in PS-16 considering that the corresponding performance specifications for CEMS that are used for the same purposes have a 20 percent relative accuracy limit. They note that previous approvals of PEMS were based on the 20 percent criterion in the draft Web site performance specifications. They also argued that the added stringency of having to certify at a level twice as accurate as a CEMS under the same compliance conditions was not warranted.
The 20 percent relative accuracy limit was set for CEMS in the 1970's and reflects the performance capabilities of systems at that time. State-of-the-art CEMS are capable of much better performance as can be seen by their success under the tighter part 75 rules where a 10 percent relative accuracy is required. We have obtained performance data on a number of installed PEMS currently in use (see EPA-HQ-OAR-2003-0074-0002, 0003, and 0004 docket entries), and the data show an overwhelming majority of the PEMS are capable of meeting a 10 percent criterion on a repeated basis. We believe the quality of emissions data should parallel the increased capabilities of newer technologies, not the capabilities of older, outdated systems. Therefore, the 10 percent relative accuracy limit for PEMS is retained in this final rule.
E. Alternative Limits for Low Emitters
Several commenters asked that alternative relative accuracy limits be allowed for low-emitting sources. They were concerned that the 10 percent relative accuracy limit would be problematic for low-emitters because the error in the reference method measurement plays a significant part in the accuracy determination at low concentrations. One commenter noted that many permits set emission limits just above the typical emission level of the source. This results in low-emitting sources running in the 75-95 percent of the emission standard range. The proposed alternative limits would only be of use when the unit is operating either below 25 or below 10 percent of the emission standard. They thought it would be more practical to base alternative criteria on the measured concentration ranges instead of the emission standard. Two commenters suggested scaling the relative accuracy requirement such that 10 percent would be the limit for measurements over 100 ppm, 20 percent for measurements between 10 and 100 ppm, and within 2 ppm for measurements under 10 ppm.
We understand the commenters' concerns and think their suggestion for alternative criteria for low emitters is a practical idea. We have added the suggested alternative criteria for concentrations between 10 and 100 ppm (20 percent RA) and below 10 ppm (± 2 ppm difference between PEMS and reference method).
F. Statistical Tests
One commenter thought the relative accuracy requirements are, in some cases, too severe and would prevent (1) even most CEMS from certifying using standard reference method testing and (2) all but the most sophisticated PEMS from passing certification. Two commenters proposed using daily zero and span calibration checks and quarterly linearity checks as alternatives to the statistical tests and quarterly relative accuracy audits (RAA). Others recommended longer sampling times to obtain the needed data for the relative accuracy statistical tests similar to the 40 CFR part 75, Subpart E requirements. Several commenters stated that they anticipated difficulty in meeting the 0.8 r-correlation requirement in tests where process variations are small. One commenter recommended the proposed waiver of the correlation test be made permanent if the data are determined to be either auto-correlated or if the signal-to-noise ratio of the data is less than 4.
We do not believe the relative accuracy requirements are so severe as to prevent most CEMS or PEMS from certifying using standard reference method testing. Most PEMS are not amenable to daily zero and span checks or quarterly linearity checks of their sensors. The suggested long-term relative accuracy evaluation of PEMS similar to the requirements of Subpart E of part 75 would render PEMS use economically impractical under parts 60, 61, and 63. Evaluation times similar to those currently required of CEMS should be sufficient. We have taken the recommendation that the correlation test be permanently waived in cases where the data are auto-correlated or have a signal-to-noise ratio less than 4 and have made this change in PS-16.
G. Use of Portable Analyzers for the Relative Accuracy Audit
Several commenters opposed the use of portable analyzers for the quarterly relative accuracy audits. They felt the analyzers lacked sufficient accuracy to evaluate PEMS. Two commenters cited the report “Evaluation of Portable Analyzers for Use in Quality Assuring Predictive Emission Monitoring Systems for NOX” (a report prepared for EPA's Clean Air Markets Division, Washington, DC, September 8, 2004) as proof of this inadequacy. They note that in the report the only analyzer that achieved accuracy better than 10 percent was the more sophisticated analyzer using the reference method methodology. Additionally, a commenter suggested that sampling problems related to sampling point location, sample conditioning, high-moisture and volume, particulate, and high temperatures would render portable analyzers ineffective. Another commenter thought that portable analyzers, which were believed to be accurate to within 20 percent, would not be able to show that PEMS are accurate to within 10 percent.
Three commenters asked that the quarterly audit requirements be removed altogether. One commenter stated that he/she did not see any added value in the audits because PEMS were thought to be inherently reliable, and two commenters urged a return to the Web site performance specification requirement to conduct biannual relative accuracy test audits instead of quarterly relative accuracy audits.
We are not aware of and commenters did not present any data that supports the idea that PEMS are inherently accurate such that their performance is guaranteed over long periods of time. The performance of PEMS, like CEMS, depends on a number of criteria that are subject to change over time. The summary and findings of the noted Start Printed Page 12579report on portable analyzers state that “The portable analyzers produced results that were comparable to those of the CEMS and Method 7E for the two natural gas-fired combustion sources and low concentrations tested.” Portable analyzers are offered as a cheaper testing option to add flexibility to the relative accuracy audits. However, reference methods may also be used in place of portable analyzers for the relative accuracy audit. A relative accuracy audit for a validated PEMS would not be valueless but would confirm that such a PEMS is still functioning properly. Therefore, quarterly relative accuracy audits are retained and may be performed using a portable analyzer or a reference method.
H. Potential Overlap Between PS-16 and PS-17
Three commenters asked that we specifically state that PS-16 will not apply to parametric monitoring systems. We were asked to clarify that PS-16 would not cover parametric systems that are already covered under PS-17.
Performance Specification 17 applies to parametric monitoring systems (i.e., those that have associated parametric limits). Performance Specification 16 applies to predictive emission monitoring systems (i.e., those that have associated emission limits). This difference has been noted in PS-16.
I. Reduced Relative Accuracy Audit Frequency for Good Performance
One commenter proposed that quarterly relative accuracy audit tests be required for the first year after initial certification. If all tests are passed through the second year relative accuracy test audit (without tuning or additional training), the second year of relative accuracy audits would be waived. In cases of failed relative accuracy audit or relative accuracy test audit attempts during the year or any PEMS retraining that triggers recertification would nullify this option until the subsequent year. The commenter felt this waiver option was important to the viability of PEMS use at remote sites.
We believe the commenter's suggestion has merit but think that at least a semiannual test at a time approximately one-half year from the previous RATA is needed to prevent extended malfunctions. We have therefore revised PS-16 to allow a single RAA or RATA midway the second year if three prior quarters of RAA and a second annual RATA are passed without PEMS training or tuning.
VI. Judicial Review
Under section 307(b)(1) of the Clean Air Act (CAA), judicial review of this final rule is available by filing a petition for review in the U.S. Court of Appeals for the District of Columbia Circuit by May 26, 2009. Under section 307(d)(7)(B) of the CAA, only an objection to this final rule that was raised with reasonable specificity during the period for public comment can be raised during judicial review. Moreover, under section 307(b)(2) of the CAA, the requirements established by this action may not be challenged separately in any civil or criminal proceedings brought by EPA to enforce these requirements.
VII. Statutory and Executive Order Reviews
A. Executive Order 12866: Regulatory Planning and Review
This action is not a “significant regulatory action” under the terms of Executive Order 12866 (58 FR 51735, October 4, 1993) and is, therefore, not subject to review under the Executive Order.
B. Paperwork Reduction Act
This action does not impose an information collection burden under the provisions of the Paperwork Reduction Act, 44 U.S.C. 3501 et seq. Burden is defined at 5 CFR 1320.3(b). This final rule does not add information collection requirements beyond those currently required under the applicable regulations. This final rule adds performance requirements and amends testing and monitoring requirements as necessary.
C. Regulatory Flexibility Act
The Regulatory Flexibility Act (RFA) generally requires an agency to prepare a regulatory flexibility analysis of any rule subject to notice and comment rulemaking requirements under the Administrative Procedure Act or any other statute unless the agency certifies that the rule will not have a significant economic impact on a substantial number of small entities. Small entities include small businesses, small organizations, and small governmental jurisdictions.
For purposes of assessing the impacts of this rule on small entities, small entity is defined as: (1) A small business whose parent company has fewer than 100 or 1,000 employees, or fewer than 4 billion kilowatt-hr per year of electricity usage, depending on the size definition for the affected North American Industry Classification System code; (2) a small governmental jurisdiction that is a government of a city, county, town, school district or special district with a population of less than 50,000; and (3) a small organization that is any not-for-profit enterprise which is independently owned and operated and is not dominant in its field.
After considering the economic impacts of this final rule on small entities, I certify that this action will not have a significant economic impact on a substantial number of small entities. This final rule will not impose any requirements on small entities because it does not impose any additional regulatory requirements.
D. Unfunded Mandates Reform Act
This action contains no Federal mandates under the provisions of Title II of the Unfunded Mandates Reform Act of 1995 (UMRA), 2 U.S.C. 1531-1538 for State, local, or tribal governments or the private sector. This action imposes no enforceable duty on any State, local or tribal governments of the private sector. Therefore, this action is not subject to the requirements of sections 202 or 205 of the UMRA. This action is also not subject to the requirements of section 203 of UMRA because it contains no regulatory requirements that might significantly or uniquely affect small governments. This action adds procedures that apply when applicable parties choose to use a different monitoring tool than what is currently required. Other amendments are made to correct various errors in testing provisions.
E. Executive Order 13132: Federalism
Executive Order 13132 entitled “Federalism” (64 FR 43255, August 10, 1999) requires EPA to develop an accountable process to ensure “meaningful and timely input by State and local officials in the development of regulatory policies that have federalism implications.” “Policies that have federalism implications” is defined in the Executive Order to include regulations that have “substantial direct effects on the States, on the relationship between the national government and the States, or on the distribution of power and responsibilities among the various levels of government.”
This final rule does not have federalism implications. It will not have substantial direct effects on the States, on the relationship between the national government and the States, or on the distribution of power and responsibilities among the various levels of government, as specified in Executive Order 13132. This rule will benefit State and local governments by Start Printed Page 12580providing performance specifications they can use to evaluate PEMS. Other amendments being made will correct PS-11, Procedures 1 and 2, Method 24, and Method 303. No added responsibilities or increase in implementation efforts or costs for State and local governments are being added by this action. Thus, Executive Order 13132 does not apply to this rule.
F. Executive Order 13175: Consultation and Coordination with Indian Tribal Governments
This action does not have tribal implications, as specified in Executive Order 13175 (65 FR 67249, November 9, 2000). This action adds an optional monitoring tool to the monitoring provisions that have already been mandated. Thus, Executive Order 13175 does not apply to this action.
G. Executive Order 13045: Protection of Children From Environmental Health Risks and Safety Risks
EPA interprets EO 13045 (62 FR 19885, April 23, 1997) as applying only to those regulatory actions that concern health or safety risks, such that the analysis required under section 5-501 of the EO has the potential to influence the regulation. This action is not subject to EO 13045 because it does not establish an environmental standard intended to mitigate health or safety risks.
H. Executive Order 13211: Actions Concerning Regulations That significantly Affect Energy Supply, Distribution, or Use
This rule is not subject to Executive Order 13211 (66 FR 28355 (May 22, 2001)), because it is not a significant regulatory action under Executive Order 12866.
I. National Technology Transfer and Advancement Act
Section 12(d) of the National Technology Transfer and Advancement Act of 1995 (“NTTAA”), Public Law No. 104-113, 12(d) (15 U.S.C. 272 note) directs EPA to use voluntary consensus standards in its regulatory activities unless to do so would be inconsistent with applicable law or otherwise impractical. Voluntary consensus standards are technical standards (e.g., materials specifications, test methods, sampling procedures, and business practices) that are developed or adopted by voluntary consensus standards bodies. NTTAA directs EPA to provide Congress, through OMB, explanations when the Agency decides not to use available and applicable voluntary consensus standards.
This action does not involve technical standards. Therefore, EPA did not consider the use of any voluntary consensus standards.
J. Executive Order 12898: Federal Actions To Address Environmental Justice in Minority Populations and Low-Income Populations.
Executive Order (EO) 12898 (59 FR 7629 (Feb. 16, 1994)) establishes Federal executive policy on environmental justice. Its main provision directs federal agencies, to the greatest extent practicable and permitted by law, to make environmental justice part of their mission by identifying and addressing, as appropriate, disproportionately high and adverse human health or environmental effects of their programs, policies, and activities on minority populations and low-income populations in the United States.
EPA has determined that this final rule will not have disproportionately high and adverse human health or environmental effects on minority or low-income populations because it does not affect the level of protection provided to human health or the environment. This final rule does not relax the control measures on sources regulated by the rule and, therefore, will not cause emissions increases from these sources.
K. Congressional Review Act
The Congressional Review Act, 5 U.S.C. 801 et seq., as added by the Small Business Regulatory Enforcement Fairness Act of 1996, generally provides that before a rule may take effect, the agency promulgating the rule must submit a rule report, which includes a copy of the rule, to each House of the Congress and to the Comptroller General of the United States. EPA will submit a report containing this rule and other required information to the U.S. Senate, the U.S. House of Representatives, and the Comptroller General of the United States prior to publication of the rule in the Federal Register. A Major rule cannot take effect until 60 days after it is published in the Federal Register. This action is not a “major rule” as defined by 5 U.S.C. 804(2). This rule will be effective April 24, 2009.
Start List of SubjectsList of Subjects
40 CFR Part 60
- Administrative practice and procedures
- Air pollution control
- Intergovernmental relations
- Reporting and recordkeeping requirements
40 CFR Part 63
- Environmental protection
- Air pollution control
- Hazardous substances
- Reporting and recordkeeping requirements
End Signature Start Amendment PartDated: March 16, 2009.
Lisa Jackson,
Administrator.
For the reasons set out in the preamble, title 40, chapter I of the Code of Federal Regulations is amended as follows:
End Amendment Part Start PartPART 60—STANDARDS OF PERFORMANCE FOR NEW STATIONARY SOURCES
End Part Start Amendment Part1. The authority citation for Part 60 continues to read as follows:
End Amendment Part Start Amendment Part2. Section 6.7 is added to Method 24 of Appendix A-7 to read as follows:
End Amendment PartAppendix A-7 to Part 60—Test Methods 19 through 25E
* * * * *Method 24—Determination of Volatile Matter Content, Water Content, Density, Volume Solids, and Weight Solids of Surface Coatings
* * * * *6.7 ASTM D 6419-00, Test Method for Volatile Content of Sheet-Fed and Coldset Web Offset Printing Inks.
* * * * *Start Amendment Part3. Performance Specification 11 of Appendix B is amended as follows:
End Amendment Part Start Amendment Parta. By revising Section 3.4.
End Amendment Part Start Amendment Partb. By revising Section 8.6, introductory text.
End Amendment Part Start Amendment Partc. By revising paragraphs (1)(ii), (1)(iii), (2), (4), and (5) of Section 12.3
End Amendment Part Start Amendment Partd. By revising paragraph (3)(ii) of Section 12.4.
End Amendment Part Start Amendment Parte. By revising paragraphs (2) and (3) of Section 13.2.
End Amendment Part Start Amendment Partf. By adding Sections 16.8 and 16.9.
End Amendment Part Start Amendment Partg. By revising Table 1 of Section 17.0 to read as follows:
End Amendment PartAppendix B to Part 60—Performance Specifications
* * * * *Performance Specification 11—Specifications and Test Procedures for Particulate Matter Continuous Emission Monitoring Systems at Stationary Sources
* * * * *3.4 “Confidence Interval Half Range (CI)” is a statistical term and means one-half of the width of the 95 percent confidence interval around the predicted mean PM concentration (y value) calculated at the PM CEMS response value (x value) where the confidence interval is narrowest. Procedures for calculating CI are specified in section 12.3. The CI as a percent of the emission limit value (CI%) is calculated at the appropriate PM CEMS response value and Start Printed Page 12581must satisfy the criteria specified in Section 13.2 (2).
* * * * *8.6 How do I conduct my PM CEMS correlation test? You must conduct the correlation test according to the procedure given in paragraphs (1) through (5) of this section. If you need multiple correlations, you must conduct testing and collect at least 15 sets of reference method and PM CEMS data for calculating each separate correlation.
* * * * *12.3 How do I determine my PM CEMS correlation?
* * *
(1) * * *
(ii) Calculate the half range of the 95 percent confidence interval (CI) for the predicted PM concentration (ŷ) at the mean value of x, using Equation 11-8:

Where:
CI = the half range of the 95 percent confidence interval for the predicted PM concentration at the mean x value,
tdf,1-a/2 = the value for the t statistic provided in Table 1 for df = (n - 2), and
SL = the scatter or deviation of ŷ values about the correlation curve, which is determined using Equation 11-9:

Calculate the confidence interval half range for the predicted PM concentration (ŷ) at the mean x value as a percentage of the emission limit (CI%) using Equation 11-10:

Where:
CI = the half range of the 95 percent confidence interval for the predicted PM concentration at the mean x value, and
EL = PM emission limit, as described in section 13.2.
(iii) Calculate the half range of the tolerance interval (TI) for the predicted PM concentration (ŷ) at the mean x value using Equation 11-11:

Where:
TI = the half range of the tolerance interval for the predicted PM concentration (ŷ) at the mean x value,
kT = as calculated using Equation 11-12, and
SL = as calculated using Equation 11-9:

Where:
n′ = the number of test runs (n),
un′ = the tolerance factor for 75 percent coverage at 95 percent confidence provided in Table 1 for df = (n−2), and
vdf = the value from Table 1 for df = (n−2).
Calculate the half range of the tolerance interval for the predicted PM concentration (ŷ) at the mean x value as a percentage of the emission limit (TI%) using Equation 11-13:

Where:
TI = the half range of the tolerance interval for the predicted PM concentration (ŷ) at the mean x value, and
EL = PM emission limit, as described in section 13.2.
* * * * *(2) How do I evaluate a polynomial correlation for my correlation test data? To evaluate a polynomial correlation, follow the procedures described in paragraphs (2)(i) through (iv) of this section.
(i) Calculate the polynomial correlation equation, which is indicated by Equation 11-16, using Equations 11-17 through 11-22:

Where:
ŷ = the PM CEMS concentration predicted by the polynomial correlation equation, and
b0, b1, b2 = the coefficients determined from the solution to the matrix equation Ab=B
Where:

Where:
Xi = the PM CEMS response for run i,
Y i = the reference method PM concentration for run i, and
n = the number of test runs.
Calculate the polynomial correlation curve coefficients (b 0, b 1, and b 2) using Equations 11-19 through 11-21, respectively:
Start Printed Page 12582
Where:

(ii) Calculate the 95 percent confidence interval half range (CI) by first calculating the C coefficients (Co to C5) using Equations 11-23 and 11-24:

Where:

Calculate Δ using Equation 11-25 for each x value:

Determine the x value that corresponds to the minimum value of Δ (Δmin). Determine the scatter or deviation of ŷ values about the polynomial correlation curve (SP) using Equation 11-26:
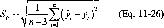
Calculate the half range of the 95 percent confidence interval (CI) for the predicted PM concentration (ŷ) at the x value that corresponds to Δmin using Equation 11-27:

Where:
df = (n-3), and
tdf = as listed in Table 1 (see section 17).
Calculate the half range of the 95 percent confidence interval for the predicted PM concentration at the x value that corresponds to Δmin as a percentage of the emission limit (CI%) using Equation 11-28:

Where:
CI = the half range of the 95 percent confidence interval for the predicted PM concentration at the x value that corresponds to Δmin, and
EL = PM emission limit, as described in section 13.2.
(iii) Calculate the tolerance interval half range (TI) for the predicted PM concentration at the x value that corresponds to Δmin, as indicated in Equation 11-29 for the polynomial correlation, using Equations 11-30 and 11-31:

Where:

un′ = the value indicated in Table 1 for df = (n′-3), and
vdf = the value indicated in Table 1 for df = (n′—3).
Calculate the tolerance interval half range for the predicted PM concentration at the x value that corresponds to Δmin as a percentage of the emission limit (TI%) using Equation 11-32:

Where:
TI = the tolerance interval half range for the predicted PM concentration at the x value that corresponds to Δmin, and
EL = PM emission limit, as described in section 13.2.
(iv) Calculate the polynomial correlation coefficient (r) using Equation 11-33:

Where:
SP = as calculated using Equation 11-26, and
Sy = as calculated using Equation 11-15.
* * * * *(4) How do I evaluate an exponential correlation for my correlation test data? To evaluate an exponential correlation, which has the form indicated by Equation 11-37, follow the procedures described in paragraphs (4)(i) through (v) of this section:
Start Printed Page 12583
(i) Perform a logarithmic transformation of each PM concentration measurement (y values) using Equation 11-38:

Where:
y′i = is the transformed value of yi, and
Ln(yi) = the natural logarithm of the PM concentration measurement for run i.
(ii) Using the values for y′i in place of the values for yi, perform the same procedures used to develop the linear correlation equation described in paragraph (1)(i) of this section. The resulting equation will have the form indicated by Equation 11-39.
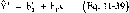
Where:
ŷ′ = the predicted log PM concentration value,
b′0 = the natural logarithm of b0, and the variables b0, b1, and x are as defined in paragraph (1)(i) of this section.
(iii) Using the values for y ′i in place of the values for yi, calculate the half range of the 95 percent confidence interval (CI′), as described in paragraph (1)(ii) of this section for CI. Note that CI′ is on the log scale. Next, calculate the upper and lower 95 percent confidence limits for the mean value y′ using Equations 11-40 and 11-41:


Where:
LCL′ = the lower 95 percent confidence limit for the mean value y′,
UCL′ = the upper 95 percent confidence limit for the mean value y′,
y′ = the mean value of the log-transformed PM concentrations, and
CI′ = the half range of the 95 percent confidence interval for the predicted PM concentration (ŷ′), as calculated in Equation 11-8.
Calculate the half range of the 95 percent confidence interval (CI) on the original PM concentration scale using Equation 11-42:

Where:
CI = the half range of the 95 percent confidence interval on the original PM concentration scale, and UCL′ and LCL′ are as defined previously.
Calculate the half range of the 95 percent confidence interval for the predicted PM concentration corresponding to the mean value of x as a percentage of the emission limit (CI%) using Equation 11-10.
(iv) Using the values for y′ i in place of the values for yi, calculate the half range tolerance interval (TI′), as described in paragraph (1)(iii) of this section for TI. Note that TI′ is on the log scale. Next, calculate the half range tolerance limits for the mean value y′ using Equations 11-43 and 11-44:


Where:
LTL′ = the lower 95 percent tolerance limit for the mean value y′,
UTL′ = the upper 95 percent tolerance limit for the mean value y′,
y′, = the mean value of the log-transformed PM concentrations, and
TI′ = the half range of the 95 percent tolerance interval for the predicted PM concentration (ŷ′), as calculated in Equation 11-11.
Calculate the half range tolerance interval (TI) on the original PM concentration scale using Equation 11-45:

TI = the half range of the 95 percent tolerance interval on the original PM scale, and UTL′ and LTL′ are as defined previously.
Calculate the tolerance interval half range for the predicted PM concentration corresponding to the mean value of x as a percentage of the emission limit (TI%) using Equation 11-13.
(v) Using the values for y ′ i in place of the values for yi, calculate the correlation coefficient (r) using the procedure described in paragraph (1)(iv) of this section.
(5) How do I evaluate a power correlation for my correlation test data? To evaluate a power correlation, which has the form indicated by Equation 11-46, follow the procedures described in paragraphs (5)(i) through (v) of this section.

(i) Perform logarithmic transformations of each PM CEMS response (x values) and each PM concentration measurement (y values) using Equations 11-35 and 11-38, respectively.
(ii) Using the values for x ′i in place of the values for xi, and the values for y ′i in place of the values for yi, perform the same procedures used to develop the linear correlation equation described in paragraph (1)(i) of this section. The resulting equation will have the form indicated by Equation 11-47:

Where:
ŷ′ = the predicted log PM concentration value, and
x′ = the natural logarithm of the PM CEMS response values,
b′0 = the natural logarithm of b0, and the variables b0, b1, and x are as defined in paragraph (1)(i) of this section.
(iii) Using the same procedure described for exponential models in paragraph (4)(iii) of this section, calculate the half range of the 95 percent confidence interval for the predicted PM concentration corresponding to the mean value of x′ as a percentage of the emission limit.
(iv) Using the same procedure described for exponential models in paragraph (4)(iv) of this section, calculate the tolerance interval half range for the predicted PM concentration corresponding to the mean value of x′ as a percentage of the emission limit.
(v) Using the values for y ′i in place of the values for yi, calculate the correlation coefficient (r) using the procedure described in paragraph (1)(iv) of this section.
Note: PS-11 does not address the application of correlation equations to calculate PM emission concentrations using PM CEMS response data during normal operations of a PM CEMS. However, we will provide guidance on the use of specific correlation models (i.e., logarithmic, exponential, and power models) to calculate PM concentrations in an operating PM CEMS in situations when the PM CEMS response values are equal to or less than zero, and the correlation model is undefined.
12.4 What correlation model should I use?
* * * * *(3) * * *
(ii) Calculate the minimum value using Equation 11-48.
 * * * * *
13.2 What performance criteria must my PM CEMS correlation satisfy?
* * * * *(2) The confidence interval half range must satisfy the applicable criterion specified in paragraph (2)(i), (ii), or (iii) of this section, based on the type of correlation model.
(i) For linear or logarithmic correlations, the 95 percent confidence interval half range at the mean PM CEMS response value from the correlation test must be within 10 percent of the PM emission limit value specified in the applicable regulation. Therefore, the CI% calculated using Equation 11-10 must be less than or equal to 10 percent.
(ii) For polynomial correlations, the 95 percent confidence interval half range at the PM CEMS response value from the correlation test that corresponds to the minimum value for Δ must be within 10 percent of the PM emission limit value specified in the applicable regulation. Therefore, the CI% calculated using Equation 11-28 must be less than or equal to 10 percent.
(iii) For exponential or power correlations, the 95 percent confidence interval half range at the mean of the logarithm of the PM CEMS response values from the correlation test must be within 10 percent of the PM emission limit value specified in the applicable regulation. Therefore, the CI% calculated using Equation 11-10 must be less than or equal to 10 percent.
(3) The tolerance interval half range must satisfy the applicable criterion specified in Start Printed Page 12584paragraph (3)(i), (ii), or (iii) of this section, based on the type of correlation model.
(i) For linear or logarithmic correlations, the half range tolerance interval with 95 percent confidence and 75 percent coverage at the mean PM CEMS response value from the correlation test must be within 25 percent of the PM emission limit value specified in the applicable regulation. Therefore, the TI% calculated using Equation 11-13 must be less than or equal to 25 percent.
(ii) For polynomial correlations, the half range tolerance interval with 95 percent confidence and 75 percent coverage at the PM CEMS response value from the correlation test that corresponds to the minimum value for Δ must be within 25 percent of the PM emission limit value specified in the applicable regulation. Therefore, the TI% calculated using Equation 11-32 must be less than or equal to 25 percent.
(iii) For exponential or power correlations, the half range tolerance interval with 95 percent confidence and 75 percent coverage at the mean of the logarithm of the PM CEMS response values from the correlation test must be within 25 percent of the PM emission limit value specified in the applicable regulation. Therefore, the TI% calculated using Equation 11-13 must be less than or equal to 25 percent.
* * * * *16.0 Which references are relevant to this performance specification?
* * * * *16.8 Snedecor, George W. and Cochran, William G. (1989), Statistical Methods, Eighth Edition, Iowa State University Press.
16.9 Wallis, W. A. (1951) “Tolerance Intervals for Linear Regression,” in Second Berkeley Symposium on Mathematical Statistics and Probability, ed. J. Neyman, Berkeley: University of California Press, pp. 43-51.
17.0 * * *
Start Amendment PartTable 1—Factors for Calculation of Confidence and Tolerance Interval Half Ranges
df Student's t, tdf Tolerance interval with 75% coverage and 95% confidence level vdf (95%) un′ (75%) kT 3 3.182 2.920 1.266 3.697 4 2.776 2.372 1.247 2.958 5 2.571 2.089 1.233 2.576 6 2.447 1.915 1.223 2.342 7 2.365 1.797 1.214 2.183 8 2.306 1.711 1.208 2.067 9 2.262 1.645 1.203 1.979 10 2.228 1.593 1.198 1.909 11 2.201 1.551 1.195 1.853 12 2.179 1.515 1.192 1.806 13 2.160 1.485 1.189 1.766 14 2.145 1.460 1.186 1.732 15 2.131 1.437 1.184 1.702 16 2.120 1.418 1.182 1.676 17 2.110 1.400 1.181 1.653 18 2.101 1.384 1.179 1.633 19 2.093 1.370 1.178 1.614 20 2.086 1.358 1.177 1.597 21 2.080 1.346 1.175 1.582 22 2.074 1.335 1.174 1.568 23 2.069 1.326 1.173 1.555 24 2.064 1.316 1.172 1.544 25 2.060 1.308 1.172 1.533 26 2.056 1.300 1.171 1.522 27 2.052 1.293 1.170 1.513 28 2.048 1.286 1.170 1.504 29 2.045 1.280 1.169 1.496 30 2.042 1.274 1.168 1.488 31 2.040 1.268 1.168 1.481 32 2.037 1.263 1.167 1.474 33 2.035 1.258 1.167 1.467 34 2.032 1.253 1.166 1.461 35 2.030 1.248 1.166 1.455 36 2.028 1.244 1.165 1.450 37 2.026 1.240 1.165 1.444 38 2.024 1.236 1.165 1.439 39 2.023 1.232 1.164 1.435 40 2.021 1.228 1.164 1.430 41 2.020 1.225 1.164 1.425 42 2.018 1.222 1.163 1.421 43 2.017 1.218 1.163 1.417 44 2.015 1.215 1.163 1.413 45 2.014 1.212 1.163 1.410 46 2.013 1.210 1.162 1.406 47 2.012 1.207 1.162 1.403 48 2.011 1.204 1.162 1.399 49 2.010 1.202 1.162 1.396 50 2.009 1.199 1.161 1.393 51 2.008 1.197 1.161 1.390 52 2.007 1.195 1.161 1.387 53 2.006 1.192 1.161 1.384 54 2.005 1.190 1.161 1.381 Start Printed Page 12585 55 2.004 1.188 1.160 1.379 56 2.003 1.186 1.160 1.376 57 2.002 1.184 1.160 1.374 58 2.002 1.182 1.160 1.371 59 2.001 1.180 1.160 1.369 60 2.000 1.179 1.160 1.367 References 16.8 (t values) and 16.9 (vdf and un′ values). 4. In Appendix B, Performance Specification 16 is added to read as follows:
End Amendment PartAppendix B to Part 60—Performance Specifications
* * * * *PERFORMANCE SPECIFICATION 16—SPECIFICATIONS AND TEST PROCEDURES FOR PREDICTIVE EMISSION MONITORING SYSTEMS IN STATIONARY SOURCES
1.0 Scope and Application
1.1 Does this performance specification apply to me? If you, the source owner or operator, intend to use (with any necessary approvals) a predictive emission monitoring system (PEMS) to show compliance with your emission limitation under 40 CFR 60, 61, or 63, you must use the procedures in this performance specification (PS) to determine whether your PEMS is acceptable for use in demonstrating compliance with applicable requirements. Use these procedures to certify your PEMS after initial installation and periodically thereafter to ensure the PEMS is operating properly. If your PEMS contains a diluent (O2 or CO2) measuring component and your emissions limitation is in units that require a diluent measurement (e.g. lbs/mm Btu), the diluent component must be tested as well. These specifications apply to PEMS that are installed under 40 CFR 60, 61, and 63 after the effective date of this performance specification. These specifications do not apply to parametric monitoring systems, these are covered under PS-17.
1.1.1 How do I certify my PEMS after it is installed? PEMS must pass a relative accuracy (RA) test and accompanying statistical tests in the initial certification test to be acceptable for use in demonstrating compliance with applicable requirements. Ongoing quality assurance tests also must be conducted to ensure the PEMS is operating properly. An ongoing sensor evaluation procedure must be in place before the PEMS certification is complete. The amount of testing and data validation that is required depends upon the regulatory needs, i.e., whether precise quantification of emissions will be needed or whether indication of exceedances of some regulatory threshold will suffice. Performance criteria are more rigorous for PEMS used in determining continual compliance with an emission limit than those used to measure excess emissions. You must perform the initial certification test on your PEMS before reporting any PEMS data as quality-assured.
1.1.2 Is other testing required after certification? After you initially certify your PEMS, you must pass additional periodic performance checks to ensure the long-term quality of data. These periodic checks are listed in the table in Section 9. You are always responsible for properly maintaining and operating your PEMS.
2.0 Summary of Performance Specification
The following performance tests are required in addition to other equipment and measurement location requirements.
2.1 Initial PEMS Certification.
2.1.1 Excess Emissions PEMS. For a PEMS that is used for excess emission reporting, the owner or operator must perform a minimum 9-run, 3-level (3 runs at each level) RA test (see Section 8.2).
2.1.2 Compliance PEMS. For a PEMS that is used for continual compliance standards, the owner or operator must perform a minimum 27-run, 3-level (9 runs at each level) RA test (see Section 8.2). Additionally, the data must be evaluated for bias and by F-test and correlation analysis.
2.2 Periodic Quality Assurance (QA) Assessments. Owners and operators of all PEMS are required to conduct quarterly relative accuracy audits (RAA) and yearly relative accuracy test audits (RATA) to assess ongoing PEMS operation. The frequency of these periodic assessments may be shortened by successful operation during a prior year.
3.0 Definitions
The following definitions apply:
3.1 Centroidal Area means that area in the center of the stack (or duct) comprising no more than 1 percent of the stack cross-sectional area and having the same geometric shape as the stack.
3.2 Data Recorder means the equipment that provides a permanent record of the PEMS output. The data recorder may include automatic data reduction capabilities and may include electronic data records, paper records, or a combination of electronic data and paper records.
3.3 Defective sensor means a sensor that is responsible for PEMS malfunction or that operates outside the approved operating envelope. A defective sensor may be functioning properly, but because it is operating outside the approved operating envelope, the resulting predicted emission is not validated.
3.4 Diluent PEMS means the total equipment required to predict a diluent gas concentration or emission rate.
3.5 Operating envelope means the defined range of a parameter input that is established during PEMS development. Emission data generated from parameter inputs that are beyond the operating envelope are not considered quality assured and are therefore unacceptable.
3.6 PEMS means all of the equipment required to predict an emission concentration or emission rate. The system may consist of any of the following major subsystems: sensors and sensor interfaces, emission model, algorithm, or equation that uses process data to generate an output that is proportional to the emission concentration or emission rate, diluent emission model, data recorder, and sensor evaluation system. Systems that use fewer than 3 variables do not qualify as PEMS unless the system has been specifically approved by the Administrator for use as a PEMS. A PEMS may predict emissions data that are corrected for diluent if the relative accuracy and relevant QA tests are passed in the emission units corrected for diluent. Parametric monitoring systems that serve as indicators of compliance and have parametric limits but do not predict emissions to comply with an emissions limit are not included in this definition.
3.7 PEMS training means the process of developing or confirming the operation of the PEMS against a reference method under specified conditions.
3.8 Quarter means a quarter of a calendar year in which there are at least 168 unit operating hours.
3.9 Reconciled Process Data means substitute data that are generated by a sensor evaluation system to replace that of a failed sensor. Reconciled process data may not be used without approval from the Administrator.
3.10 Relative Accuracy means the accuracy of the PEMS when compared to a reference method (RM) at the source. The RA is the average difference between the pollutant PEMS and RM data for a specified number of comparison runs plus a 2.5 percent confidence coefficient, divided by the average of the RM tests. For a diluent PEMS, the RA may be expressed as a percentage of absolute difference between the PEMS and RM. Alternative specifications are given for units that have very low emissions.
3.11 Relative Accuracy Audit means a quarterly audit of the PEMS against a Start Printed Page 12586portable analyzer meeting the requirements of ASTM D6522-00 or a RM for a specified number of runs. A RM may be used in place of the portable analyzer for the RAA.
3.12 Relative Accuracy Test Audit means a RA test that is performed at least once every four calendar quarters after the initial certification test while the PEMS is operating at the normal operating level.
3.13 Reference Value means a PEMS baseline value that may be established by RM testing under conditions when all sensors are functioning properly. This reference value may then be used in the sensor evaluation system or in adjusting new sensors.
3.14 Sensor Evaluation System means the equipment or procedure used to periodically assess the quality of sensor input data. This system may be a sub-model that periodically cross-checks sensor inputs among themselves or any other procedure that checks sensor integrity at least daily (when operated for more than one hour in any calendar day).
3.15 Sensors and Sensor Interface means the equipment that measures the process input signals and transports them to the emission prediction system.
4.0 Interferences [Reserved]
5.0 Safety [Reserved]
6.0 Equipment and Supplies
6.1 PEMS Design. You must detail the design of your PEMS and make this available in reports and for on-site inspection. You must also establish the following, as applicable:
6.1.1 Number of Input Parameters. An acceptable PEMS will normally use three or more input parameters. You must obtain the Administrator's permission on a case-by-case basis if you desire to use a PEMS having fewer than three input parameters.
6.1.2 Parameter Operating Envelopes. Before you evaluate your PEMS through the certification test, you must specify the input parameters your PEMS uses, define their range of minimum and maximum values (operating envelope), and demonstrate the integrity of the parameter operating envelope using graphs and data from the PEMS development process, vendor information, or engineering calculations, as appropriate. If you operate the PEMS beyond these envelopes at any time after the certification test, the data generated during this condition will not be acceptable for use in demonstrating compliance with applicable requirements. If these parameter operating envelopes are not clearly defined and supported by development data, the PEMS operation will be limited to the range of parameter inputs encountered during the certification test until the PEMS has a new operating envelope established.
6.1.3 Source-Specific Operating Conditions. Identify any source-specific operating conditions, such as fuel type, that affect the output of your PEMS. You may only use the PEMS under the source-specific operating conditions it was certified for.
6.1.4 Ambient Conditions. You must explain whether and how ambient conditions and seasonal changes affect your PEMS. Some parameters such as absolute ambient humidity cannot be manipulated during a test. The effect of ambient conditions such as humidity on the pollutant concentration must be determined and this effect extrapolated to include future anticipated conditions. Seasonal changes and their effects on the PEMS must be evaluated unless you can show that such effects are negligible.
6.1.5 PEMS Principle of Operation. If your PEMS is developed on the basis of known physical principles, you must identify the specific physical assumptions or mathematical manipulations that support its operation. If your PEMS is developed on the basis of linear or nonlinear regression analysis, you must make available the paired data (preferably in graphic form) used to develop or train the model.
6.1.6 Data Recorder Scale. If you are not using a digital recorder, you must choose a recorder scale that accurately captures the desired range of potential emissions. The lower limit of your data recorder's range must be no eater than 20 percent of the applicable emission standard (if subject to an emission standard). The upper limit of your data recorder's range must be determined using the following table. If you obtain approval first, you may use other lower and upper recorder limits.
If PEMS is measuring. . . And if. . . Then your upper limit. . . Uncontrolled emissions, such as NOX at the stack of a natural gas-fired boiler No other regulation sets an upper limit for the data recorder's range Must be 1.25 to 2 times the average potential emission level Uncontrolled emissions, such as NOX at the stack of a natural gas-fired boiler Another regulation sets an upper limit for the data recorder's range Must follow the other regulation Controlled emissions Must be 1.5 to 2.0 times concentration of the emission standard that applies to your emission unit Continual compliance emissions for an applicable regulation Must be 1.1 to 1.5 times the concentration of the emission standard that applies to your emission unit 6.1.7 Sensor Location and Repair. We recommend you install sensors in an accessible location in order to perform repairs and replacements. Permanently installed platforms or ladders may not be needed. If you install sensors in an area that is not accessible, you may be required to shut down the emissions unit to repair or replace a sensor. Conduct a new RATA after replacing a sensor. All sensors must be calibrated as often as needed but at least as often as recommended by the manufacturers.
6.1.8 Sensor Evaluation System. Your PEMS must be designed to perform automatic or manual determination of defective sensors on at least a daily basis. This sensor evaluation system may consist of a sensor validation sub-model, a comparison of redundant sensors, a spot check of sensor input readings at a reference value, operation, or emission level, or other procedure that detects faulty or failed sensors. Some sensor evaluation systems generate substitute values (reconciled data) that are used when a sensor is perceived to have failed. You must obtain prior approval before using reconciled data.
6.1.9 Parameter Envelope Exceedances. Your PEMS must include a plan to detect and notify the operator of parameter envelope exceedances. Emission data collected outside the ranges of the sensor envelopes will not be considered quality assured.
6.2 Recordkeeping. All valid data recorded by the PEMS must be used to calculate the emission value.
7.0 Reagents and Standards [Reserved]
8.0 Sample Collection, Preservation, Storage, and Transport
8.1 Initial Certification. Use the following procedure to certify your PEMS. Complete all PEMS training before the certification begins.
8.2 Relative Accuracy Test.
8.2.1 Reference Methods. Unless otherwise specified in the applicable regulations, you must use the test methods in Appendix A of this part for the RM test. Conduct the RM tests at three operating levels of the key parameter that most affects emissions (e.g., load level). Conduct the specified number of RM tests at the low (minimum to 50 percent of maximum), mid (an intermediary level between the low and high levels), and high (80 percent to maximum) key parameter operating levels, as practicable. If these levels are not practicable, vary the key parameter range as much as possible over three levels.
8.2.2 Number of RM Tests for Excess Emission PEMS. For PEMS used for excess emission reporting, conduct at least the following number of RM tests at the following key parameter operating levels:
(1) Three at a low level.
(2) Three at a mid level.
(3) Three at a high level.
You may choose to perform more than nine total RM tests. If you perform more than nine tests, you may reject a maximum of three tests as long as the total number of test results used to determine the RA is nine or greater and each operating level has at least three tests. You must report all data, including the rejected data. Start Printed Page 12587
8.2.3 Number of RM Tests for Continual Compliance PEMS. For PEMS used to determine compliance, conduct at least the following number of RM tests at the following key parameter operating levels:
(1) Nine at a low level.
(2) Nine at a mid level.
(3) Nine at a high level.
You may choose to perform more than 9 RM runs at each operating level. If you perform more than 9 runs, you may reject a maximum of three runs per level as long as the total number of runs used to determine the RA at each operating level is 9 or greater.
8.2.4 Reference Method Measurement Location. Select an accessible measurement point for the RM that will ensure you measure emissions representatively. Ensure the location is at least two equivalent stack diameters downstream and half an equivalent diameter upstream from the nearest flow disturbance such as the control device, point of pollutant generation, or other place where the pollutant concentration or emission rate can change. You may use a half diameter downstream instead of the two diameters if you meet both of the following conditions:
(1) Changes in the pollutant concentration are caused solely by diluent leakage, such as leaks from air heaters.
(2) You measure pollutants and diluents simultaneously at the same locations.
8.2.5 Traverse Points. Select traverse points that ensure representative samples. Conduct all RM tests within 3 cm of each selected traverse point but no closer than 3 cm to the stack or duct wall. The minimum requirement for traverse points are as follows:
(1) Establish a measurement line across the stack that passes through the center and in the direction of any expected stratification.
(2) Locate a minimum of three traverse points on the line at 16.7, 50.0, and 83.3 percent of the stack inside diameter.
(3) Alternatively, if the stack inside diameter is greater than 2.4 meters, you may locate the three traverse points on the line at 0.4, 1.2, and 2.0 meters from the stack or duct wall. You may not use this alternative option after wet scrubbers or at points where two streams with different pollutant concentrations are combined. You may select different traverse points if you demonstrate and provide verification that it provides a representative sample. You may also use the traverse point specifications given the RM.
8.2.6 Relative Accuracy Procedure. Perform the number of RA tests at the levels required in Sections 8.2.2 and 8.2.3. For integrated samples (e.g., Method 3A or 7E), make a sample traverse of at least 21 minutes, sampling for 7 minutes at each traverse point. For grab samples (e.g., Method 3 or 7), take one sample at each traverse point, scheduling the grab samples so that they are taken simultaneously (within a 3-minute period) or at an equal interval of time apart over a 21-minute period. A test run for grab samples must be made up of at least three separate measurements. Where multiple fuels are used in the monitored unit and the fuel type affects the predicted emissions, determine a RA for each fuel unless the effects of the alternative fuel on predicted emissions or diluent were addressed in the model training process. The unit may only use fuels that have been evaluated this way.
8.2.7 Correlation of RM and PEMS Data. Mark the beginning and end of each RM test run (including the exact time of day) on the permanent record of PEMS output. Correlate the PEMS and the RM test data by the time and duration using the following steps:
A. Determine the integrated pollutant concentration for the PEMS for each corresponding RM test period.
B. Consider system response time, if important, and confirm that the pair of results is on a consistent moisture, temperature, and diluent concentration basis.
C. Compare each average PEMS value to the corresponding average RM value. Use the following guidelines to make these comparisons.
If . . . Then . . . And then . . . The RM has an instrumental or integrated non-instrumental sampling technique Directly compare RM and PEMS results The RM has a grab sampling technique Average the results from all grab samples taken during the test run. The test run must include ≥3 separate grab measurements Compare this average RM result with the PEMS result obtained during the run. Use the paired PEMS and RM data and the equations in Section 12.2 to calculate the RA in the units of the applicable emission standard. For this 3-level RA test, calculate the RA at each operation level.
8.3 Statistical Tests for PEMS that are Used for Continual Compliance. In addition to the RA determination, evaluate the paired RA and PEMS data using the following statistical tests.
8.3.1 Bias Test. From the RA data taken at the mid-level, determine if a bias exists between the RM and PEMS. Use the equations in Section 12.3.1.
8.3.2 F-test. Perform a separate F-test for the RA paired data from each operating level to determine if the RM and PEMS variances differ by more than might be expected from chance. Use the equations in Section 12.3.2.
8.3.3 Correlation Analysis. Perform a correlation analysis using the RA paired data from all operating levels combined to determine how well the RM and PEMS correlate. Use the equations in Section 12.3.3. The correlation is waived if the process cannot be varied to produce a concentration change sufficient for a successful correlation test because of its technical design. In such cases, should a subsequent RATA identify a variation in the RM measured values by more than 30 percent, the waiver will not apply, and a correlation analysis test must be performed at the next RATA.
8.4 Reporting. Summarize in tabular form the results of the RA and statistical tests. Include all data sheets, calculations, and charts (records of PEMS responses) necessary to verify that your PEMS meets the performance specifications. Include in the report the documentation used to establish your PEMS parameter envelopes.
8.5 Reevaluating Your PEMS After a Failed Test, Change in Operations, or Change in Critical PEMS Parameter. After initial certification, if your PEMS fails to pass a quarterly RAA or yearly RATA, or if changes occur or are made that could result in a significant change in the emission rate (e.g., turbine aging, process modification, new process operating modes, or changes to emission controls), your PEMS must be recertified using the tests and procedures in Section 8.1. For example, if you initially developed your PEMS for the emissions unit operating at 80-100 percent of its range, you would have performed the initial test under these conditions. Later, if you wanted to operate the emission unit at 50-100 percent of its range, you must conduct another RA test and statistical tests, as applicable, to verify that the new conditions of 50-100 percent of range are functional. These tests must demonstrate that your PEMS provides acceptable data when operating in the new range or with the new critical PEMS parameter(s). The requirements of Section 8.1 must be completed by the earlier of 60 unit operating days or 180 calendar days after the failed RATA or after the change that caused a significant change in emission rate.
9.0 Quality Control
You must incorporate a QA plan beyond the initial PEMS certification test to verify that your system is generating quality-assured data. The QA plan must include the components of this section.
9.1 QA/QC Summary. Conduct the applicable ongoing tests listed below.
Ongoing Quality Assurance Tests
Test PEMS regulatory purpose Acceptability Frequency Sensor Evaluation All Daily Start Printed Page 12588 RAA Compliance 3-test average ≤10% of simultaneous PEMS average Each quarter except quarter when RATA performed RATA All Same as for RA in Sec. 13.1 Yearly in quarter when RAA not performed Bias Correction All If davg ≤ |cc| Bias test passed (no correction factor needed) PEMS Training All If Fcritical ≥F r ≥0.8 Optional after initial and subsequent RATAs Sensor Evaluation Alert Test (optional) All See Section 6.1.8 After each PEMS training 9.2 Daily Sensor Evaluation Check. Your sensor evaluation system must check the integrity of each PEMS input at least daily.
9.3 Quarterly Relative Accuracy Audits. In the first year of operation after the initial certification, perform a RAA consisting of at least three 30-minute portable analyzer or RM determinations each quarter a RATA is not performed. The average of the 3 portable analyzer or RM determinations must not differ from the simultaneous PEMS average value by more than 10 percent of the analyzer or RM value or the test is failed. If a PEMS passes all quarterly RAAs in the first year and also passes the subsequent yearly RATA in the second year, you may elect to perform a single mid-year RAA in the second year in place of the quarterly RAAs. This option may be repeated, but only until the PEMS fails either a mid-year RAA or a yearly RATA. When such a failure occurs, you must resume quarterly RAAs in the quarter following the failure and continue conducting quarterly RAAs until the PEMS successfully passes both a year of quarterly RAAs and a subsequent RATA.
9.4 Yearly Relative Accuracy Test Audit. Perform a minimum 9-run RATA at the normal operating level on a yearly basis in the quarter that the RAA is not performed.
10.0 Calibration and Standardization [Reserved]
11.0 Analytical Procedure [Reserved]
12.0 Calculations and Data Analysis
12.1 Nomenclature
B = PEMS bias adjustment factor.
cc = Confidence coefficient.
di = Difference between each RM and PEMS run.
d = Arithmetic mean of differences for all runs.
ei = Individual measurement provided by the PEMS or RM at a particular level.
em = Mean of the PEMS or RM measurements at a particular level.
ep = Individual measurement provided by the PEMS.
ev = Individual measurement provided by the RM.
F = Calculated F-value.
n = Number of RM runs.
PEMSi = Individual measurement provided by the PEMS.
PEMSiAdjusted = Individual measurement provided by the PEMS adjusted for bias.
PEMS = Mean of the values provided by the PEMS at the normal operating range during the bias test.
r = Coefficient of correlation.
RA = Relative accuracy.
RAA = Relative accuracy audit.
RM = Average RM value (or in the case of the RAA, the average portable analyzer value). In cases where the average emissions for the test are less than 50 percent of the applicable standard, substitute the emission standard value here in place of the average RM value.
Sd = Standard deviation of differences.
S2 = Variance of your PEMS or RM.
t0.025 = t-value for a one-sided, 97.5 percent confidence interval (see Table 16-1).
12.2 Relative Accuracy Calculations. Calculate the mean of the RM values. Calculate the differences between the pairs of observations for the RM and the PEMS output sets. Finally, calculate the mean of the differences, standard deviation, confidence coefficient, and PEMS RA, using Equations 16-1, 16-2, 16-3, and 16-4, respectively. For compliance PEMS, calculate the RA at each test level. The PEMS must pass the RA criterion at each test level.
12.2.1 Arithmetic Mean. Calculate the arithmetic mean of the differences between paired RM and PEMS observations using Equation 16-1.

12.2.2 Standard Deviation. Calculate the standard deviation of the differences using Equation 16-2 (positive square root).

12.2.3 Confidence Coefficient. Calculate the confidence coefficient using Equation 16-3 and Table 16-1.

12.2.4 Relative Accuracy. Calculate the RA of your data using Equation 16-4.

12.3 Compliance PEMS Statistical Tests. If your PEMS will be used for continual compliance purposes, conduct the following tests using the information obtained during the RA tests. For the pollutant measurements at any one test level, if the mean value of the RM is less than either 10 ppm or 5 percent of the emission standard, all statistical tests are waived at that specific test level. For diluent measurements at any one test level, if the mean value of the RM is less than 3 percent of span, all statistical tests are waived for that specific test level.
12.3.1 Bias Test. Conduct a bias test to determine if your PEMS is biased relative to the RM. Determine the PEMS bias by comparing the confidence coefficient obtained from Equation 16-3 to the Start Printed Page 12589arithmetic mean of the differences determined in Equation 16-1. If the arithmetic mean of the differences (d̄) is greater than the absolute value of the confidence coefficient (cc), your PEMS must incorporate a bias factor to adjust future PEMS values as in Equation 16-5.

Where:

12.3.2 F-test. Conduct an F-test for each of the three RA data sets collected at different test levels. Calculate the variances of the PEMS and the RM using Equation 16-6.

Determine if the variance of the PEMS data is significantly different from that of the RM data at each level by calculating the F-value using Equation 16-7.

Compare the calculated F-value with the critical value of F at the 95 percent confidence level with n-1 degrees of freedom. The critical value is obtained from Table 16-2 or a similar table for F-distribution. If the calculated F-value is greater than the critical value at any level, your proposed PEMS is unacceptable. For pollutant PEMS measurements, if the standard deviation of the RM is less than either 3 percent of the span or 5 ppm, use a RM standard deviation of either 5 ppm or 3 percent of span. For diluent PEMS measurements, if the standard deviation of the reference method is less than 3 percent of span, use a RM standard deviation of 3 percent of span.
12.3.3 Correlation Analysis. Calculate the correlation coefficient either manually using Eq. 16-8, on a graph, or by computer using all of the paired data points from all operating levels. Your PEMS correlation must be 0.8 or greater to be acceptable. If during the initial certification test, your PEMS data are determined to be auto-correlated according to the procedures in 40 CFR 75.41(b)(2), or if the signal-to-noise ratio of the data is less than 4, then the correlation analysis is permanently waived.

12.4 Relative Accuracy Audit. Calculate the quarterly RAA using Equation 16-4.

13.0 Method Performance
13.1 PEMS Relative Accuracy. The RA must not exceed 10 percent if the PEMS measurements are greater than 100 ppm or 0.2 lbs/mm Btu. The RA must not exceed 20 percent if the PEMS measurements are between 100 ppm (or 0.2 lb/mm Btu) and 10 ppm (or 0.05 lb/mm Btu). For measurements below 10 ppm, the absolute mean difference between the PEMS measurements and the RM measurements must not exceed 2 pppm. For diluent PEMS, an alternative criterion of ± 1 percent absolute difference between the PEMS and RM may be used if less stringent.
13.2 PEMS Bias. Your PEMS data is considered biased and must be adjusted if the arithmetic mean (d) is greater than the absolute value of the confidence coefficient (cc) in Equations 16.1 and 16.3. In such cases, a bias factor must be used to correct your PEMS data.
13.3 PEMS Variance. Your calculated F-value must not be greater than the critical F-value at the 95-percent confidence level for your PEMS to be acceptable.
13.4 PEMS Correlation. Your calculated r-value must be greater than or equal to 0.8 for your PEMS to be acceptable.
13.5 Relative Accuracy Audits. The average of the 3 portable analyzer or RM determinations must not differ from the simultaneous PEMS average value by more than 10 percent of the analyzer or RM value.
14.0 Pollution Prevention [Reserved]
15.070 Waste Management [Reserved]
16.0 References [Reserved]
17.0 Tables, Diagrams, Flowcharts, and Validation Data
Start Printed Page 12590Table 16-1—t-Values for One-sided, 97.5 Percent Confidence Intervals for Selected Sample Sizes*
n-1 t0.025 n-1 t0.025 2 12.706 16 2.131 3 4.303 17 2.120 4 3.182 18 2.110 5 2.776 19 2.101 6 2.571 20 2.093 7 2.447 21 2.086 8 2.365 22 2.080 9 2.306 23 2.074 10 2.262 24 2.069 11 2.228 25 2.064 12 2.201 26 2.060 13 2.179 27 2.056 14 2.160 28 2.052 15 2.145 > 29 t-Table * Use n equal to the number of data points (n-1 equals the degrees of freedom). Start Amendment PartTable 16-2. F-Values for Critical Value of F at the 95 Percent Confidence Level
d.f. for S2RM 1 2 3 4 5 6 7 8 9 d.f. for S2PEMS 10 11 12 1 161 199 215 224 230 234 236 238 240 241 243 243 .4 .5 .7 .6 .2 .0 .8 .9 .5 .8 .0 .9 2 18 19 19 19 19 19 19 19 19 19 19 19 51 00 16 25 30 33 35 37 38 50 40 41 3 10 9.5 9.2 9.1 9.0 8.9 8.8 8.8 8.8 8.7 8.7 8.7 13 52 77 17 14 41 87 45 12 86 63 45 4 7.7 6.9 6.5 6.3 6.2 6.1 6.0 6.0 5.9 5.9 5.9 5.9 09 44 91 88 56 63 94 41 99 64 35 12 5 6.6 5.7 5.4 5.1 5.0 4.9 4.8 4.8 4.7 4.7 4.7 4.6 08 86 10 92 50 50 76 18 73 35 03 78 6 5.9 5.1 4.7 4.5 4.3 4.2 4.2 4.1 4.0 4.0 4.0 4.0 87 43 57 34 87 84 07 47 99 60 27 00 7 5.5 4.7 4.3 4.1 3.9 3.8 3.7 3.7 3.6 3.6 3.6 3.5 91 34 47 20 71 66 87 26 77 37 03 75 8 5.3 4.4 4.0 3.8 3.6 3.5 3.5 3.4 3.3 3.3 3.3 3.2 18 59 66 38 88 81 01 38 88 47 12 84 9 5.1 4.2 3.8 3.6 3.4 3.3 3.2 3.2 3.1 3.1 3.1 3.0 17 57 63 33 82 74 93 30 97 37 02 73 10 4.9 4.1 3.7 3.4 3.3 3.2 3.1 3.0 3.0 2.9 2.9 2.9 65 03 09 78 26 17 36 72 20 78 42 13 11 4.8 3.9 3.5 3.3 3.2 3.0 3.0 2.9 2.8 2.8 2.8 2.7 44 82 87 57 04 95 12 48 96 54 17 88 12 4.7 3.8 3.4 3.2 3.1 2.9 2.9 2.8 2.7 2.7 2.7 2.6 47 85 90 59 06 96 13 49 96 53 17 87 5. In Procedure 1 of Appendix F, paragraph (3) of Section 5.1.2 and Section 8 is revised as follows:
End Amendment PartAppendix F to Part 60—Quality Assurance Procedures
Procedure 1. Quality Assurance Requirements for Gas Continuous Emission Monitoring Systems Used for Compliance Determination
* * * * *5.1.2 Cylinder Gas Audit (CGA).
* * *
(3) Use Certified Reference Materials (CRM's) (See Citation 1) audit gases that have been certified by comparison to National Institute of Standards and Technology (NIST) or EPA Traceability Protocol Materials (ETPM's) following the most recent edition of EPA's Traceability Protocol No. 1 (See Citation 2). Procedures for preparation of CRM's are described in Citation 1. Procedures for preparation of ETPM's are described in Citation 2. As an alternative to CRM's or ETPM gases, Method 205 (See Citation 3) may be used. The difference between the actual concentration of the audit gas and the concentration indicated by the monitor is used to assess the accuracy of the CEMS.
* * * * *8. Bibliography
1. “A Procedure for Establishing Traceability of Gas Mixtures to Certain National Bureau of Standards Standard Reference Materials.” Joint publication by NBS and EPA-600/7-81-010, Revised 1989. Available from the U.S. Environmental Protection Agency. Quality Assurance Division (MD-77). Research Triangle Park, NC 27711.
2. “EPA Traceability Protocol For Assay And Certification Of Gaseous Calibration Standards.” EPA-600/R-97/121, September 1997. Available from EPA's Emission Measurement Center at http://www.epa.gov/ttn/emc.
3. Method 205, “Verification of Gas Dilution Systems for Field Instrument Calibrations,” 40 CFR 51, Appendix M.
* * * * *Start Amendment Part6. In Procedure 2 of Appendix F, Section 10.1, paragraph (3) of Section 10.4, and paragraph (2) of Section 12.0 are revised as follows:
End Amendment PartProcedure 2—Quality Assurance Requirements for Particulate Matter Continuous Emission Monitoring Systems at Stationary Sources
* * * * *10.1 When should I use paired trains for reference method testing? Although not required, we recommend that you should use paired-train reference method testing to generate data used to develop your PM CEMS correlation and for RCA testing. Guidance on the use of paired sampling trains can be found in the PM CEMS Knowledge Document (see section 16.5 of PS-11).
* * * * *10.4 What are my limits for excessive audit inaccuracy?
* * * * *(3) What are the criteria for excessive ACA error? Your PM CEMS is out of control if the results of any ACA exceed ± 10 percent of the average audit value, as calculated using Equation 2-1a, or 7.5 percent of the applicable standard, as calculated using Equation 2-1b, whichever is greater.
* * * * *12.0 What calculations and data analysis must I perform for my PM CEMS?
* * * * *(2) How do I calculate ACA accuracy? You must use either Equation 2-1a or 2-1b to calculate ACA accuracy for each of the three audit points. However, when calculating ACA accuracy for the first audit point (0 to 20 percent of measurement range), you must use Equation 2-1b to calculate ACA accuracy if the reference standard value (Rv) equals zero.
Start Printed Page 12591
Where:
ACA Accuracy = The ACA accuracy at each audit point, in percent,
RCEM = Your PM CEMS response to the reference standard, and
RV = The reference standard value.

Where:
ACA Accuracy = The ACA accuracy at each audit point, in percent,
CCEM = The PM concentration that corresponds to your PM CEMS response to the reference standard, as calculated using the correlation equation for your PM CEMS,
CRV = The PM concentration that corresponds to the reference standard value in units consistent with CCEM, and
Cs = The PM concentration that corresponds to the applicable emission limit in units consistent with CCEM.
* * * * *Start PartPart 63—[Amended]
End Part Start Amendment Part7. The authority citation for Part 63 continues to read as follows:
End Amendment Part Start Amendment Part8. In Method 303 of Appendix A, add a sentence to the end of Section 1.1 to read as follows:
End Amendment Part Start AppendixAppendix A to Part 63—Test Methods
Method 303—Determination of Visible Emissions From By-Product Coke Oven Batteries
1.1 Applicability. * * * In order for the test method results to be indicative of plant performance, the time of day of the run should vary.
End Appendix End Supplemental Information[FR Doc. E9-6275 Filed 3-24-09; 8:45 am]
BILLING CODE 6560-50-P


Document Information
- Comments Received:
- 0 Comments
- Effective Date:
- 4/24/2009
- Published:
- 03/25/2009
- Department:
- Environmental Protection Agency
- Entry Type:
- Rule
- Action:
- Final rule.
- Document Number:
- E9-6275
- Dates:
- This final rule is effective on April 24, 2009.
- Pages:
- 12575-12591 (17 pages)
- Docket Numbers:
- EPA-HQ-OAR-2003-0074, FRL-8785-4
- RINs:
- 2060-AG21: Amendments for Testing and Monitoring Provisions to Part 60, Part 61, and Part 63
- RIN Links:
- https://www.federalregister.gov/regulations/2060-AG21/amendments-for-testing-and-monitoring-provisions-to-part-60-part-61-and-part-63
- Topics:
- Administrative practice and procedure, Air pollution control, Environmental protection, Hazardous substances, Intergovernmental relations, Reporting and recordkeeping requirements
- PDF File:
- e9-6275.pdf
- CFR: (2)
- 40 CFR 60
- 40 CFR 63