2015-31319. Final Fair Market Rents for the Housing Choice Voucher Program and Moderate Rehabilitation Single Room Occupancy Program and Other Programs Fiscal Year 2016
-
Start Preamble
Start Printed Page 77124
AGENCY:
Office of the Assistant Secretary for Policy Development and Research, HUD.
ACTION:
Notice of Final Fiscal Year (FY) 2016 Fair Market Rents (FMRs).
SUMMARY:
Section 8(c)(1) of the United States Housing Act of 1937 (USHA) requires the Secretary of HUD to publish FMRs periodically, but not less than annually, adjusted to be effective on October 1 of each year. The primary uses of FMRs are to determine payment standards for the Housing Choice Voucher (HCV) program; to determine initial renewal rents for some expiring project-based Section 8 contracts; to determine initial rents for housing assistance payment contracts in the Moderate Rehabilitation Single Room Occupancy program; and, to serve as rent ceilings for rental assistance units in the HOME Investment Partnerships program. FMRs are used in the calculation of maximum award amounts for Continuum of Care grantees and are used in the calculation of flat rents in Public Housing units. Today's notice provides final FY 2016 FMRs for all areas that reflect the estimated 40th and 50th percentile rent levels trended to FY 2016. The FY 2016 FMRs use rent data collected by Bureau of the Census by the American Community Survey (ACS). This rent data is collected over a five-year period, from 2009 through 2013. These data are updated by one-year 2013 ACS data for areas where statistically valid one-year ACS data is available. HUD continues to use ACS data in different ways according to the statistical reliability of rent estimates. The Consumer Price Index (CPI) rent and utility indexes are used to further update the data to 2014. These values are then trended forward to FY 2016. Based on the comments received and as way to estimate FMRs more accurately, HUD has replaced the historical-based annualized change in gross rent trend factor with a forward-looking forecast for these final FY 2016 FMRs. The national trend factor for the final FY 2016 FMRs uses a model that forecasts national rent and utility CPI indices based on economic assumptions used in the formulation of the President's Budget.
The FY 2016 FMRs incorporate a change in the level of statistical reliability that allowed for an ACS estimate to be used in the calculation of FMRs. Previously, if the error of the estimate was less than the estimate itself, HUD used the estimate. The FY 2016 FMRs use ACS estimates where the size of the error is limited to half of the estimate. An additional change to the FY 2016 FMRs is the incorporation of the February 28, 2013, Office of Management and Budget (OMB) metropolitan area definition update based on the 2010 Decennial Census data. The 2013 ACS data are the first to use the new area definitions in the compilation of the ACS data. Bedroom ratios (comparing zero-, one-, three- and four-bedroom rents to the two-bedroom base rent) were updated from the 2010 estimations using a three-year average of five-year ACS data.
DATES:
Effective Date: The FMRs published in this notice are effective on the date of publication.
Start Further InfoFOR FURTHER INFORMATION CONTACT:
For technical information on the methodology used to develop FMRs or a listing of all FMRs, please call the HUD USER information line at 800-245-2691 or access the information on the HUD USER Web site http://www.huduser.gov/portal/datasets/fmr.html. FMRs are shown at the 40th or 50th percentile in Schedule B. For informational purposes, the 40th percentile recent-mover rents for the areas with 50th percentile FMRs will be provided in the HUD FY 2016 FMR documentation system at http://www.huduser.gov/portal/datasets/fmr/fmrs/docsys.html?data=fmr16 and the 50th percentile rents for all FMR areas will be published at http://www.huduser.gov/portal/datasets/50per.html after publication of final FY 2016 FMRs. Unadjusted rents (rents calculated directly from ACS data prior to the application of state minimum rents) will be made available at: http://www.huduser.gov/portal/datasets/fmr.html. These rents may be used in conjunction with the calculation of flat rents in the Public Housing program. Additionally, Small Area FMRs, which may also be used as the basis for Public Housing flat rents as an alternative to metropolitan wide FMRs, are available at: http://www.huduser.gov/portal/datasets/fmr/smallarea/index.html.
Questions related to use of FMRs or voucher payment standards should be directed to the respective local HUD program office. Questions on how to conduct FMR surveys or concerning further methodological explanations may be addressed to Marie L. Lihn or Peter B. Kahn, Economic and Market Analysis Division, Office of Economic Affairs, Office of Policy Development and Research, telephone 202-402-2409. Persons with hearing or speech impairments may access this number through TTY by calling the toll-free Federal Relay Service at 800-877-8339. (Other than the HUD USER information line and TDD numbers, telephone numbers are not toll-free.)
Electronic Data Availability: This Federal Register notice is available electronically from the HUD User page at http://www.huduser.gov/portal/datasets/fmr.html. Federal Register notices also are available electronically at https://www.federalregister.gov/,, the Federal Register Web site. Complete documentation of the methodology and data used to compute each area's final FY 2016 FMRs is available at http://www.huduser.gov/portal/datasets/fmr.html through the link labeled “Individual Area Final FY 2016 FMR Documentation.” Final FY 2016 FMRs are available in a variety of electronic formats at http://www.huduser.gov/portal/datasets/fmr.html. FMRs may be accessed in PDF format as well as in Microsoft Excel. A new HUD User page has been developed for Small Area FMRs and those based on final FY 2016 Metropolitan Area Rents and historical versions of this data will be on this site http://www.huduser.gov/portal/datasets/fmr/smallarea/index.html and there is a link from the FMR page of HUD User http://www.huduser.gov/portal/datasets/fmr.html. Please note that these Small Area FMRs are for reference only, except where they are used by public housing authorities (PHAs) participating in the Small Area FMR demonstration and for PHAs investigating an alternative basis for Public Housing flat rents. With approval from the Housing Voucher Management Division of the Office of Public and Indian Housing (PIH) these Small Area FMRs may be used in the process of determining exception payment standards.
End Further Info End Preamble Start Supplemental InformationSUPPLEMENTARY INFORMATION:
I. Background
Section 8 of the USHA (42 U.S.C. 1437f) authorizes housing assistance to aid lower-income families in renting safe and decent housing. Housing assistance payments are limited by FMRs established by HUD for different geographic areas. In the HCV program, the FMR is the basis for determining the “payment standard amount” used to calculate the maximum monthly subsidy for an assisted family (see 24 CFR 982.503). In general, the FMR for Start Printed Page 77125an area is the amount that would be needed to pay the gross rent (shelter rent plus utilities) of privately owned, decent, and safe rental housing of a modest (non-luxury) nature with suitable amenities. In addition, all rents subsidized under the HCV program must meet reasonable rent standards. HUD's regulations at 24 CFR 888.113 require the Department to establish 50th percentile FMRs for certain areas.
II. Procedures for the Development of FMRs
Section 8(c)(1) of the USHA requires the Secretary of HUD to publish FMRs periodically, but not less frequently than annually. Section 8(c)(1) states, in part:
Proposed fair market rentals for an area shall be published in the Federal Register with reasonable time for public comment and shall become effective upon the date of publication in final form in the Federal Register. Each fair market rental in effect under this subsection shall be adjusted to be effective on October 1 of each year to reflect changes, based on the most recent available data trended so the rentals will be current for the year to which they apply, of rents for existing or newly constructed rental dwelling units, as the case may be, of various sizes and types in the market area suitable for occupancy by persons assisted under this section.
HUD's regulations at 24 CFR part 888 provide that HUD will develop proposed FMRs, publish them for public comment, provide a public comment period of at least 30 days, analyze the comments, and publish final FMRs. (See 24 CFR 888.115.) For FY 2016 FMRs, HUD has considered all comments submitted in response to its September 8, 2015 (80 FR 53819) proposed FY 2016 FMRs and includes its responses to these comments in this notice.
In addition, HUD's regulations at 24 CFR 888.113 set out procedures for HUD to assess whether areas are eligible for FMRs at the 50th percentile. Minimally qualified areas [1] are reviewed each year unless not eligible to be reviewed. Areas that currently have 50th percentile FMRs are evaluated for progress in voucher tenant concentration after three years in the program. Continued eligibility is determined using HUD's administrative data that show levels of voucher tenant concentration. The levels of voucher tenant concentration must be above 25 percent and show a decrease in concentration since the last evaluation. At least 85 percent of the voucher units in the area must be reported for a determination on the status of a 50th percentile area. Areas are not qualified for review if they are within the three-year period as a 50th-percentile area or have lost 50th-percentile status for failure to de-concentrate within the last three years.
In FY 2015 there were 16 areas using 50th-percentile FMRs. Of these 16 areas, six areas were eligible for evaluation. Only three of the six areas will continue as 50th-percentile FMR areas; two of the remaining three areas do not show measurable deconcentration over the three-year period, will not continue as 50th-percentile FMR areas, and will not be considered for the 50th percentile FMR program for three years. One area, New Haven-Meriden, CT HUD Metro FMR Area (HMFA), that was evaluated graduated from the program; this area will be re-evaluated each year. This is a different result for the Baltimore-Columbia-Towson, MD Metropolitan Statistical Area (MSA) than in the proposed FY 2016 FMRs, where deconcentration was not measured. After reviewing the data in response to comments, it was discovered that areas up for re-evaluation were not afforded a full three annual time-periods to deconcentrate. A re-evaluation of all areas using three annual time-periods resulted in the continuation of the Baltimore metropolitan area in the 50th percentile FMR program; Fort Lauderdale and Richmond, even with the additional year, did not exhibit measurable deconcentration. Housing authorities in these two areas are encouraged to review the rules at 24 CFR 982.503(f) to determine if they qualify for continued use of the 50th percentile rents when setting their payment standards. One area, Washington, DC-VA-MD HMFA, that failed to deconcentrate as of FY 2013 will once again become a 50th percentile FMR area.
In summary, there will be 14 50th-percentile FMR areas in FY 2016. In Schedule B, where all FMRs are listed by state and area, an asterisk designates the 50th percentile FMR areas. The following table lists the FMR areas along with the year of their next evaluation.
FY 2016—50th-Percentile FMR Areas and Year of Next Reevaluation
Albuquerque, NM MSA 2018 Baltimore-Columbia-Towson, MD MSA 2019 Chicago-Joliet-Naperville, IL HUD Metro FMR Area 2018 Denver-Aurora-Broomfield, CO MSA 2018 Hartford-West Hartford-East Hartford, CT HUD Metro FMR Area 2018 Honolulu, HI MSA 2018 Kansas City, MO-KS HUD Metro FMR Area 2018 Milwaukee-Waukesha-West Allis, WI MSA 2018 Philadelphia-Camden-Wilmington, PA-NJ-DE-MD MSA 2019 Riverside-San Bernardino-Ontario, CA MSA 2018 Tacoma, WA HUD Metro FMR Area 2018 Virginia Beach-Norfolk-Newport News, VA-NC MSA 2018 Washington, DC-VA-MD HUD Metro FMR Area 2019 West Palm Beach-Boca Raton, FL HUD Metro FMR Area 2019 III. Proposed FY 2016 FMRs
On September 8, 2015 (80 FR 53819), HUD published proposed FY 2016 FMRs with a comment period that ended October 8, 2015. All comments are available for review on the Federal Government's Web site for capturing comments on proposed regulations and related documents (Regulations.gov—http://www.regulations.gov/#!docketBrowser;rpp=25;po=0;dct=PS;D=HUD-2015-0072).
IV. FMR Methodology
This section provides a brief overview of the calculation steps for the FY 2016 FMRs. For complete information on how FMR areas are determined by each specific FMR area, see the online documentation by FMR area http://www.huduser.gov/portal/datasets/fmr/fmrs/docsys.html?data=fmr16.
The proposed FY 2016 FMRs are based on the updated metropolitan area definitions published by OMB on February 28, 2013. Counties that have been removed from metropolitan areas will be nonmetropolitan counties. Start Printed Page 77126Counties that have been added to metropolitan areas will be treated as metropolitan county subareas. These counties will receive rents based on their own data if the local data is statistically reliable (with an error that is less than one-half of the estimate) or receive the metropolitan rent if their subarea estimate does not exist or is statistically unreliable. New multi-county metropolitan areas will be treated as individual county metropolitan subareas using county-based gross rent estimates (if statistically reliable); otherwise, a metropolitan, area-wide gross rent estimate is used.
A. Base Year Rents
The U.S. Census Bureau released standard tabulations of five-year ACS data collected between 2009 through 2013 in December of 2014. For FY 2016 FMRs, HUD uses special tabulations of this five-year ACS data collected between 2009 through 2013 to update the base rents that provide the 40th and 50th percentile standard quality rents that were provided in May 2015. HUD has updated base rents each year based on new five-year data since FY 2012, for which HUD used 2005-2009 ACS data. For FY 2016 FMRs, HUD updated the base rents set in FY 2015 using the 2008-2012 five-year data with the 2009-2013 five-year ACS data.[2] HUD updates base rents for Puerto Rico FMRs using the 2009-2013 Puerto Rico Community Survey (PRCS); HUD first updated the Puerto Rico base rents in FY 2014 based on 2007-2011 PRCS data collected through the ACS program. The Bureau of the Census does not collect data annually using the ACS for the Pacific Islands (Guam, Northern Marianas and American Samoa) or the US Virgin Islands; however, as part of the 2010 Decennial Census, the Census Bureau conducted a “long-form” sample surveys for these areas. These data are incorporated in the FY 2016 FMRs. For the first time, St. John, USVI will have an FMR that is separate from St. Thomas, USVI and American Samoa and the Northern Mariana Islands will have FMRs separate from Guam.
HUD historically based FMRs on gross rents for recent movers (those who have moved into their current residence in the last 24 months). However, due to the nature of the five-year ACS data, HUD developed a new methodology for calculating recent-mover FMRs in FY 2012. As in FY 2012, HUD assigns all areas a base rent equal to the estimated two-bedroom standard quality five-year gross rent from the ACS.[3] Because HUD's regulations mandate that FMRs represent recent mover gross rents, HUD continues to apply a recent mover factor to the standard quality base rents assigned from the five-year ACS data.
B. Recent Mover Factor
Following the assignment of the standard quality two-bedroom rent described above, HUD applies a recent mover factor to these rents. The calculation of the recent mover factor for FY 2016 is similar to the methodology HUD used in FY 2015, with the only difference being the use of updated ACS data and the change to the statistical reliability assessment of the ACS data. The following describes the process for determining the appropriate recent mover factor.
In general, HUD uses one-year, two-bedroom recent mover gross rents from the special tabulation of the ACS for the smallest geographic area encompassing the FMR area that is statistically reliable to calculate the recent mover factor.[4] HUD calculates some areas' recent mover factors using data collected just for the FMR area. In these cases, the recent mover factor effectively removes the five-year data from the calculation of the FMRs. For areas with statistically reliable recent mover data for the FMR area itself, the one-year recent mover two-bedroom gross rent becomes the base rent for the area. However, HUD bases other areas' recent mover factors on larger geographic areas if this is necessary to obtain statistically reliable estimates. For metropolitan areas that are subareas of larger metropolitan areas, the recent mover hierarchy is FMR area, metropolitan area, aggregated metropolitan parts of the state, and state. Metropolitan areas that are not divided follow a similar path from FMR area, to aggregated metropolitan parts of the state, to state. In nonmetropolitan areas, HUD bases the recent mover factor on the FMR area, the aggregated nonmetropolitan parts of the state, or if that is not available, based on the whole state. HUD calculates the recent mover factor as the percentage change between the five-year 2009-2013 standard quality two-bedroom gross rent and the one-year 2013 recent mover two-bedroom gross rent for the recent mover factor area. HUD does not allow recent mover factors to lower the standard quality base rent; therefore, if the five-year standard quality rent is larger than the comparable one-year recent mover rent the recent mover factor is set to 1.0. The process for calculating each area's recent mover factor is detailed in the FY 2016 Final FMR documentation system available at: http://www.huduser.gov/portal/datasets/fmr/fmrs/docsys.html?data=fmr16. Applying the recent mover factor to the standard quality base rent produces an “as of” 2013 recent mover two-bedroom base gross rent for the FMR area.
C. Other Rent Survey Data
A new base rent has been calculated for the insular areas using the 2010 decennial census of American Samoa, Guam, the Northern Mariana Islands, and the Virgin Islands. This is the first time American Samoa and the Northern Mariana Islands will have an FMR that is separate from Guam. In addition, St. Johns, VI will receive a separate FMR; previously it was combined with St. Thomas. The 2010 rent data is updated to 2013 using the change in national ACS rents from 2010 to 2013.
In addition to the Pacific island areas, HUD does not use the ACS as the base rent or recent mover factor for eight areas where the FY 2016 FMR is based on survey data. Surveys conducted in 2012 for Hood River County, OR, Mountrail County, ND, Ward County, ND, and Williams County, ND are used as base rents. Survey data from 2012 survey still represents the most current data available for these areas where only five-year ACS data exists. These base rents are adjusted to 2014 using regional CPI data. Surveys conducted in 2014 for Bennington County, VT, Windham County, VT, Windsor County, VT, and Seattle, WA are used for base rents. HUD has no funds to conduct surveys of FMR areas, and so future surveys must be paid for by the PHAs.
D. Updates From 2013 to 2014
HUD updates the ACS-based “as of” 2013 rent through the end of 2014 using the annual change in gross rents measured from the CPI between 2013 and 2014. As in previous years, HUD uses Local CPI data coupled with Consumer Expenditure Survey (CEX) data for FMR areas with at least 75 percent of their population within Class A metropolitan areas covered by local CPI data. HUD uses Census region CPI Start Printed Page 77127data for FMR areas in Class B and C size metropolitan areas and nonmetropolitan areas without local CPI update factors. Additionally, HUD is using CPI data collected locally in Puerto Rico as the basis for CPI adjustments from 2013 to 2014 for all Puerto Rico FMR areas.
E. Trend From 2014 to April 2016
The trend factor for the final FY 2016 FMRs has been changed from the annualized change in median gross rents as measured across the most recent five years of available 1-year ACS data, used in the proposed FY 2016 FMRs as published on September 8, 2015 (80 FR 53817). Instead, HUD trends the final FY 2016 FMRs forward with national forecasts of the rent and utility components of CPI, resulting in an increase in the FMR for all areas. The trend factor applied for the Proposed FY 2016 FMRs was 1.0334 percent; the forecast trend factor applied to the Final FY 2016 FMRs is 1.0457. The trend factor is the weighted average change between the most recent annual Rent of Primary Residence and Utility CPIs and the same indices forecasted to the relevant fiscal year.
F. Puerto Rico Utility Adjustments
The gross rent data from the 2009 to 2013 Puerto Rico Community Survey (PRCS) coupled with the local CPI data measured across Puerto Rico includes the utility rate increases from Commonwealth-owned utility companies that was the basis for utility rate adjustments across all Puerto Rico FMR areas in both FY 2014 and FY 2015. The FY 2016 FMRs no longer include the utility adjustment; any changes in the Puerto Rico energy tariffs have been in effect long enough to be included in the Puerto Rico CPI. As pointed out in a comment by the Commonwealth of Puerto Rico Division of Housing, the South Region CPI was inadvertently used for the calculation of Proposed FY 2016 FMRs throughout Puerto Rico, and this has been corrected.
G. Bedroom Rent Adjustments
HUD calculates the primary FMR estimates for two-bedroom units. This is generally the most common sized rental unit and, therefore, the most reliable to survey and analyze. Formerly, after each Decennial Census, HUD calculated rent relationships between two-bedroom units and other unit bedroom counts and used them to set FMRs for other units. HUD did this because it is much easier to update two-bedroom estimates and to use pre-established cost relationships with other unit bedroom counts than it is to develop independent FMR estimates for each unit bedroom count. When calculating FY 2013 FMRs, HUD updated the bedroom ratio adjustment factors using 2006-2010 five-year ACS data. The bedroom ratio methodology used in this update was the same methodology that was used when calculating bedroom ratios using 2000 Census data. The bedroom ratios HUD used in the calculation of FY 2016 FMRs have been updated using average data from three five-year data series (2007-2011, 2008-2012, and 2009- 2013). This update incorporates the most recent available data while also smoothing the potential variability from the discontinuity of resetting the bedroom ratios once every five years.
HUD establishes bedroom interval ranges based on an analysis of the range of such intervals for all areas with large enough samples to permit accurate bedroom ratio determinations. These ranges are: Efficiency FMRs are constrained to fall between 0.62 and 0.82 of the two-bedroom FMR; one-bedroom FMRs must be between 0.75 and 0.86 of the two-bedroom FMR; three-bedroom FMRs must be between 1.14 and 1.34 of the two-bedroom FMR; and, four-bedroom FMRs must be between 1.27 and 1.62 of the two-bedroom FMR. (The maximums for the three-bedroom and four-bedroom FMRs are irrespective of the adjustments discussed in the next paragraph.) HUD adjusts bedroom rents for a given FMR area if the differentials between bedroom-size FMRs were inconsistent with normally observed patterns (i.e., efficiency rents are not allowed to be higher than one-bedroom rents and four-bedroom rents are not allowed to be lower than three-bedroom rents). The bedroom ratios for Puerto Rico follow these constraints.
HUD further adjusts the rents for three-bedroom and larger units to increase the likelihood that the largest families, who have the most difficulty in leasing units, will be successful in finding eligible program units. The adjustment adds 8.7 percent to the unadjusted three-bedroom FMR estimates and adds 7.7 percent to the unadjusted four-bedroom FMR estimates. The FMRs for unit sizes larger than four bedrooms are calculated by adding 15 percent to the four-bedroom FMR for each extra bedroom. For example, the FMR for a five-bedroom unit is 1.15 times the four-bedroom FMR, and the FMR for a six-bedroom unit is 1.30 times the four-bedroom FMR. FMRs for single-room occupancy units are 0.75 times the zero-bedroom (efficiency) FMR.
For low-population, nonmetropolitan counties with small or statistically insignificant data for any two of the three five-year ACS standard quality rents series used in the average, HUD uses state non-metropolitan data to determine bedroom ratios for each unit bedroom count. HUD made this adjustment to protect against unrealistically high or low FMRs due to insufficient sample sizes.
V. Manufactured Home Space Surveys
The FMR used to establish payment standard amounts for the rental of manufactured home spaces (pad rentals including utilities) in the HCV program is 40 percent of the FMR for a two-bedroom unit. HUD will consider modification of the manufactured home space FMRs where public comments present statistically valid survey data showing the 40th-percentile manufactured home space rent (including the cost of utilities) for the entire FMR area.
All approved exceptions to these rents based on survey data that were in effect in FY 2015 were updated to FY 2016 using the same data used to estimate the HCV program FMRs. If the result of this computation was higher than 40 percent of the new two-bedroom rent, the exception remains and is listed in Schedule D. The FMR area definitions used for the rental of manufactured home spaces are the same as the area definitions used for the other FMRs. No additional exception requests were received in the comments to the FY 2016 Proposed FMRs.
VI. Small Area Fair Market Rents
Small Area Fair Market Rents (SAFMRs) replace the use of FMRs for the HCV program as part of a court settlement by all public housing authorities (PHAs) in the Dallas, TX HMFA. SAFMRs are also used in HUD's demonstration program by five PHAs: The Housing Authority of the County of Cook (IL), the City of Long Beach (CA) Housing Authority, the Chattanooga (TN) Housing Authority, the Town of Mamaroneck (NY) Housing Authority, and the Laredo (TX) Housing Authority. The SAFMRs used by Dallas and the PHAs in the demonstration are listed in the Schedule B addendum.
SAFMRs are calculated using a rent ratio determined by dividing the median gross rent across all bedrooms for the small area (a ZIP code) by the similar median gross rent for the metropolitan area of the ZIP code. Similar to the bedroom ratios discussed in item G of section IV or this notice, HUD calculates the ZIP code rent ratio using an average of 2007-2011, 2008-2012, and 2009-2013 data. This average rent ratio is multiplied by the current two-bedroom Start Printed Page 77128rent for the entire metropolitan area containing the small area to generate the current year two-bedroom rent for the small area. In small areas where the median gross rent is not statistically reliable, HUD substitutes the median gross rent for the county containing the ZIP code in the numerator of the rent ratio calculation. For FY 2016 SAFMRs, HUD uses the updated bedroom rent ratios discussed above.[5]
HUD also makes Small Area FMRs for all metropolitan areas available at http://www.huduser.gov/portal/datasets/fmr/smallarea/index.html. Housing Authorities may use these Small Area FMRs as a guide for setting payment standards within their FMR area and may use them in requesting exception payment standards in accordance with 24 CFR 982.503(c)(2)(A).
VII. Public Comments Overview of Comments
A. Overview
A total of 83 comments were received and are posted on the regulations.gov site (not all duplicate comments were posted) (http://www.regulations.gov/#!docketBrowser;rpp=25;po=0;dct=PS;D=HUD-2015-0072), which is also linked on the HUD User FMR page http://www.huduser.gov/portal/datasets/fmr.html. Most comments contested FMR reductions compared with the FY 2015 FMRs and several noted that year-over-year changes are not keeping up with a tight rental market. While many comments included some type of market data, none provided market rent data that could be used for an adjustment of the FY 2016 FMRs. The FMR methodology has been the subject of Inspector General of HUD and Government Accounting Office studies, and it is clear that the use of such real-time data as found in newspaper ads or Craigslist cannot be used to adjust FMRs, because this data is not statistically representative of the FMR area. While surveys of rents must be conducted to contest the FMRs, HUD has been unable to fund such surveys for several years; consequently, PHAs must fund their own surveys, if needed. None of these commenters provided a statistically valid survey of rents that could be used to adjust the FY 2016 FMRs. The timing between proposed and final was admittedly too short to conduct a study of statistically valid rents and several commenters announced their intention to conduct rent surveys, which if statistically different will be incorporated in a revised FY 2016 FMR publication. Several commenters who did not experience a reduction in FY 2016 FMRs complained about the small increase in light of rental market conditions for their area; and some nonmetropolitan areas were concerned with the large increases and decreases that the ACS data provides.
The use of FMRs in the calculation of public housing flat rents continues to garner comments. Small nonmetropolitan areas find the flat rents based on FMRs are too high for their market. Where the state minimum is used, a nonmetropolitan county does have the option of using its own, lower rent. A suggestion that FMRs be adjusted based on square footage of units is not feasible because the data on size of units is not available for all areas from a statistically reliable source. While FMRs are used in other HUD programs, the methodology used in determining FMRs and the publication of FMRs for comment is primarily in support of the Section 8 HCV program. Other HUD programs must rely on the current FMR methodology. The adjustment of flat rents by FMRs is an issue for the program staff in the Division of Housing Management and Occupancy of PIH. HUD's Office of Policy Development, and Research supports the program office by making the Small Area FMRs and the unadjusted rents available as alternatives to the FMR for setting Public Housing flat rents.
Many commenters oppose decreases of any level in the FMR, especially those commenters that operate programs that use FMRs but do not allow payment standard flexibility in applying FMRs, such as the Continuum of Care program and the Low-Income Housing Tax Credit program (LIHTC). Several comments requested that HUD hold the FY 2016 FMRs harmless, that is they wanted the FMR to remain at the FY 2015 level, or some earlier level if it would otherwise be lower. In addition to, or instead of, implementing a hold harmless policy, several comments asked HUD to limit annual increases and decreases of FMRs to five percent, or at the very least impose a hard floor of five percent on decreases. This inability to hold FMRs harmless at some previously higher level is especially difficult for LIHTC landlords and developers to understand because no such prohibition exists for the calculation of HUD's income limits which are also used in the rent calculation for these units. HUD has been able to use such measures in constraining income limit increases and decreases, but HUD is specifically precluded from incorporating these changes into the FMR methodology by the statutory language governing FMRs requiring the use of the most recent available data. As stated in previous FMR notices, HUD's HCV program counsel reviewed the statutory language governing the calculation of FMRs to determine if the Department has the authority to institute caps and floors on the amount the FMRs could change annually. Based on this review, HUD's program counsel issued a legal opinion that HUD CANNOT impose floors or caps in changes in FMRs because this would violate the portion of the statute that directs HUD to use the most current data available. According to the legal opinion, the statute must be changed before HUD can implement these types of caps and floors. No statutory changes regarding the use of the most recent available data have since been enacted; consequently, HUD does not have the authority to use a hold harmless policy or other policy which would permit HUD to impose caps and floors on FMR changes. HUD is required to use the most recent available data and FMRs must increase or decrease based on this data. Ignoring decreases or phasing decreases or increases in over several years would not fully implement FMRs based on the most recent available data.
The Department recognizes that significant variation in FMRs from year to year increases the administrative burden on all users of FMRs. HUD has made changes to the calculation methodology to attempt to quell this annual variation while comporting to the statutory requirement to use the most recent data available. For example, using averages of 3 years of five-year ACS data in the calculation of the bedroom ratios and the small area rent ratios were implemented to increase the stability of these components of the calculations while also incorporating the most recent data each year. Moving to a tighter statistical standard for use of ACS estimates (less than a 50 percent margin of error as opposed to different from 0) is also incorporated to lessen the variability from sampling error within the ACS while still taking advantage of annually updated information. HUD will continue to pursue strategies that increase the stability of the FMRs from year to year within the limitations of the current statutory framework.
Although there were several changes to the metropolitan area definitions for Start Printed Page 77129the FY 2016 FMRs, geographic area comments were submitted for only two areas: Columbia city, MD and Barranquitas, PR. HUD proposed to remove the place-based FMR for Columbia city, MD that it had since the 1970s. HUD proposed to do this because Columbia city is unique among FMR areas to receive this treatment and was created before exception payment standards existed. The Final FY 2016 FMRs maintain the proposed area definitions and continue to incorporate Columbia city, MD as part of the Baltimore-Columbia-Towson, MD MSA. To ensure that voucher families currently living in the city are not impacted, and to ensure future voucher families are able to access rental units in Columbia city, HUD is issuing exception payment standards at up to 132 percent of the metropolitan FMR for the area. The comment discussing proposed FY 2016 FMRs in Puerto Rico agreed with HUD's policy for not maintaining Quebradillas Municipio as part of the Barranquitas-Aibonito-Quebradillas, PR HUD Metro FMR area, a subarea of the San Juan, PR MSA, noting that it was not a contiguous Municipio. The comment also requested that Maunaubo Municipio also be separated from Barranquitas. Maunaubo Municipio is also not contiguous to any of the other four central municipios; notwithstanding the geographic discontinuity, HUD did not change the Maunaubo Municipio's area definition for FY 2016. HUD will attempt to evaluate this request, due to geographic discontinuity, after acquiring the necessary data as part of the FY 2017 FMR process.
Several PHAs with lower proposed FY 2016 FMRs relative to FY 2015 or earlier FMRs requested that HUD conduct a survey of rents for their FMR areas. As stated in the proposed FY 2016 FMR Notice, HUD does not have funds available to conduct surveys in FY 2016. While some areas provided data, the data could not be accepted as the basis for changing FMRs because it did not meet the threshold for representativeness and/or statistical reliability established for rental survey data to be used in FMR determinations. HUD may not use data from newspaper ads (or Craigslist) because these sources for rents do not represent actual contracted rents, nor can rent reasonableness studies be used as these typically do not sample units randomly. Other data provided may be acceptable, but the sources and method of collection must be identified. Data must be collected randomly and cover the entire rental stock within the FMR area including single-family units, not just large apartment projects. Single-family units and smaller apartment buildings are an important part of the rental market and cannot be ignored. HUD did receive notification that several PHAs in metropolitan and nonmetropolitan areas are conducting surveys and have sought guidance from HUD on the survey methodology. Any other PHAs interested in surveys to support changes in FMRs should review section VIII of this notice for further information regarding acceptable survey methodology.
For areas that are considering conducting their own surveys, HUD would caution them to explore all no-cost options as a means of alleviating problems they are having with low FMRs. HUD has experience conducting surveys in areas with low or no vacancy rates and this experience has shown that it is extremely difficult to capture accurate gross rent levels in tight markets. For that reason, HUD provides emergency exception payment standards up to 135 percent of the FMR for the Section 8 voucher program in areas impacted by natural resource exploration or in presidentially declared disaster areas. PHAs interested in applying for these exception payment standards should contact their local HUD field office. Other programs that use FMRs will have to pursue similar strategies such as exception payment standards or hold harmless provisions within the statutory and regulatory framework governing those programs.
HUD received a comment from the Inclusive Communities Project (ICP), regarding the Small Area FMRs in the Dallas, TX HUD Metro FMR Area. ICP used HUD's guidance on how to provide data-supported comments on the levels of Small Area FMRs using HUD's special tabulations of the distribution of gross rents by bedroom unit size for ZIP Code Tabulation Areas. HUD has reviewed the comment and has made the appropriate change to the final FY 2016 Small Area FMRs for the Dallas, TX HUD Metro FMR Area.
B. Issues Raised in Comments and HUD Responses
In accordance with 24 CFR 888.115, HUD has reviewed the public comments that were submitted by the due date and has adjusted the proposed FMRs accordingly. Furthermore, HUD has determined that there are no comments with “statistically valid rental survey data that justify the requested changes in metropolitan areas or non-metropolitan counties.” HUD's responses to all known comments received by the comment due date and a part of the notice record http://www.regulations.gov/#!docketBrowser;rpp=25;po=0;dct=PS;D=HUD-2015-0072 follow.
Comment: FMR decreases do not reflect the current rental market; more recent data must be used for the determination of FMRs. Several of the areas expressing dissatisfaction with decreases, provided market studies, rent reasonableness findings, or rent data compiled from rents for large apartment projects that show that the rents in their area increased in the past year, while the FY 2016 FMRs show a decline from the FY 2015 FMRs. Over 30 comments from tenants, landlords, housing advocacy and development organizations and PHAs protested the reduction in the Oakland, CA metropolitan area that resulted from the replacement of a 2013 local survey with 2013 ACS one-year data. Their claim is that in such a tight rental market, as experienced in Oakland, even the relatively small decreases of less than two percent for efficiencies through three-bedroom units (four-bedroom FMRs decreased 10 percent compared with last year as a result of the bedroom ratio re-estimation), will hurt a program with huge waiting lists and low success rates. Most of these commenters requested that HUD revise the FY 2016 FMRs by using the 2014 ACS data (one year 2014 standard tabulations were made available on September 17, 2015).
HUD Response: FMRs are estimated rents, and can change from year-to-year in ways that are different from market rent changes or economic activity. Such a year-over-year comparison is especially invalid when data from a local survey is replaced with one-year ACS data, as is the case for Burlington, VT, Oakland, CA, and Santa Barbara, CA. When economic activity decreases, rents don't necessarily decrease and some increased economic activity that might put pressure on rents cannot be measured in real time. HUD is required to use the most current data available and this means that local surveys conducted in 2013 must be replaced by 2013 ACS data for areas with one-year ACS data. HUD is precluded from using sources of data that are not statistically reliable. Rent reasonableness studies are not subject to the same constraints on statistical reliability and cannot be used to alter FMRs.
HUD is unable to use the 2014 ACS data in the calculation of the FY 2016 FMRs. The standard tabulations of ACS data based on the 2014 data collection have not been completely released at this time. Furthermore, HUD cannot use the standard tabulations of ACS data to Start Printed Page 77130set the level of the FMRs for the following reasons:
1. Standard tabulations do not provide 40th percentile rent estimates.
2. Standard tabulations are not available for certain HUD Metropolitan FMR Areas.
3. Standard tabulations may not be filtered to eliminate substandard units or units likely to be subsidized with gross rents below HUD's Public Housing Cut Off Rent.
4. Standard tabulations do not have gross rents specific to recent movers.
Given the limitations of the data in the standard tabulations, HUD reviewed the available data to determine if any improvements to the FMR calculations in the Oakland, CA HUD Metro FMR area could be made. One possibility HUD considered was to replace the CPI based gross rent inflation factor capturing rent growth between 2013 and 2014. The CPI based inflation factor for gross rents used in the proposed FY 2016 FMR calculation is 5.33 percent. The change in the median gross rents measured for the Oakland-Haywood-Berkeley, CA Metropolitan Division, which comprised of Alameda and Contra Costa Counties—the same as the FMR area, between 2013 one-year ACS data and 2014 one-year ACS data is only 4.1. Consequently, incorporating the information from the standard tabulations of ACS data that are available now would LOWER the FY 2016 FMRs rather than raise them as the comments suggest.
Comment: FMRs should be held harmless at the FY 2015 levels. Several comments requested that FMRs not be allowed to decline from their FY 2015 level, especially where FY 2015 data included a local survey. Some of these comments provided market data that showed current rents in apartment projects that were higher than the FMR.
HUD Response: HUD cannot ignore the more current 2013 ACS data and allow FMRs to stay the same as they were for FY 2015; FY 2015 FMRs were based on gross rents from the 2012 ACS. By statute (42 U.S.C. 1437f(c)(1)(B)) and regulation (24 CFR 888.113(e)), HUD is required to use the most current data available. Apartment buildings of five units or more are only one segment of the rental market in a FMR area. Typical data submitted in comments to this notice provided information on rents for units in this segment, which generally account for less than half of the rental market for those areas. Single-family homes, both attached and detached (including townhomes and duplexes), small rental apartments, and mobile homes make up the rest of the rental market. While rent surveys conducted either by HUD or a PHA would provide more current data than the ACS, these surveys take about two months to complete and can be quite expensive. HUD does not have funds available to conduct any surveys in 2016 and cannot delay the implementation of FY 2016 FMRs while new surveys are being conducted. Rents in areas with relatively short-term market tightening are not easily measured by rent surveys. Based on past experience HUD finds that an area must have rent increases or declines for a period of at least two years before changes can be accurately measured by surveys. Should the survey results show market conditions that are statistically different from the published FMRs, HUD will revise the FY 2016 FMRs. HUD recommends following the survey guidance available at the bottom of the Web page http://www.huduser.org/portal/datasets/fmr.html for small metropolitan areas without consistent one-year ACS data and nonmetropolitan areas. For large areas with significant one-year ACS data, the requirement for completed recent mover surveys are greater; there must be about 200 two-bedroom (or two-bedroom and equivalent one-bedroom and possibly equivalent three-bedroom) recent mover surveys where the FMR is not within the confidence interval of the survey. HUD will review the results of private surveys and will revise the Final FY 2016 FMRs if warranted. For small nonmetropolitan counties, HUD will work with the PHA to simplify the requirements for obtaining valid survey results. The selection of the units surveyed must be random and the distribution of the structures surveyed must be representative of the distribution of structure types from the 2013 ACS. HUD will not accept a survey that is comprised only of apartment project rentals, any more than it would accept private project rental data for major metropolitan areas as a means of revising FMRs. This data typically excludes single-family rentals, which are generally about one-third of the rental market for an area, and this percentage can be greater in small metropolitan areas and nonmetropolitan counties.
Comment: Reductions in FMRs are discouraging the development of affordable multifamily housing projects. Decreases in FMRs reduce the financial viability of Low Income Housing Tax Credit (LIHTC) projects that are limited to Section 8 voucher.
HUD Response: For years, HUD held income limits harmless to eliminate the effect of lower rents on LIHTC units, assuming rents were income based. But, the effect of this policy was to create areas where there were no changes in income limits for years, which also did not provide adequate rents for LIHTC projects. Congress provided statutory hold harmless income limits for LIHTC projects, and special income limits for projects in service by December 31, 2008, that were subject to HUD's Hold Harmless policy in either 2007 or 2008. Beginning with the FY 2010 HUD Income Limits HUD eliminated its hold harmless policy for other income limits, but limited annual changes in income limits to plus or minus five percent (or greater if on average there was an annual increase in the national median family income of more than five percent). Since that time, LIHTC developers have planned for decreases in income-based rents between the time projects are proposed and placed in service. FMRs have always increased and decreased with the change in the data. HUD cannot ignore the requirement to use the most current data by only implementing FMR changes in five percent increments. Statutory and regulatory changes are required before HUD would be able to implement any methodology changes that deviate from the use of the most current rent data available.
Comment: Market rents did not decrease in the past year and neither should FMRs. Many areas protested decreases or even slight increases in the FMRs in areas where success rates are falling (Oakland and Santa Barbara) or large decreases where the economy is increasing and putting pressures on the housing market (Sioux City). Several commenters stated that market rents did not decrease and in fact increased over the past year, so FMRs should not decrease. Both Santa Cruz, CA and Burlington, VT experienced large declines in FY 2016 FMRs compared with FY 2015 FMRs. The decline in Santa Cruz was based on the decrease in recent mover gross rents measured by the 2013 one-year ACS data, and in Burlington the decrease was driven by the replacement of a December 2012-based local survey with 2013 one-year ACS data.
HUD Response: FMRs do not represent a time series of rent data for each FMR area. When market rents for areas increase, decrease, or stay the same, FMRs do not necessarily have the same directional change. The FMR process, as currently designed, develops the best estimate of the 40th (or 50th) percentile gross rent for a particular area using the timeliest available data covering the entire market area; this process revise past FMR estimates with updated information. Therefore, year-over-year FMR changes can sometimes Start Printed Page 77131seemingly conflict with perceived market trends. Annual revisions to all of the underlying data used to estimate FMRs are now possible with the five-year ACS data. Because of the nature of the ACS five-year tabulations, however, 80 percent of the survey observations will remain the same from one year to the next, but are re-weighted to match the population and housing unit estimates of the final year of the five- year range. Also many rural FMR areas rely on update factors based on survey results from a larger, encompassing geographic area (for example, state-based update factors used for nonmetropolitan counties). Even if the base rent is not adjusted the annual changes in FMRs do not necessarily reflect very recent changes in the housing market conditions for the smaller area but still represent HUD's best estimate of 40th percentile gross rents in the FMR area.
Comment: HUD should validate its FMR estimation methodology by comparing one-year ACS data with fiscal year FMRs for the same year, beginning with a comparison of 2006 one-year ACS rent data to the FY 2006 FMRs. This analysis would determine which aspects of HUD's discretionary methodology is less accurate and could help HUD modify its methodology to improve accuracy while adhering to the requirement to use the most recent data available. The up and down changes that occur with the final fair market rents cause a lot of problems and stress for the landlords, tenants and the PHAs.
HUD Response: Because the integration of ACS data into the FMR estimation process has been gradual and evolving, and will continue to evolve to address issues like volatility in estimates arising from large sampling variation in smaller markets, there is not yet a basis for making the suggested comparison. FMR methodology and the underlying data have been relatively stable only between FY 2013 and FY 2016 FMRs. ACS data on recent-mover rents is only available for one of these years. Further, because the ACS only produces highly reliable estimates of the 40th percentile recent mover two-bedroom rent in the largest metropolitan areas, the comparison would only be valid for large markets, and FMRs have not been particularly volatile in these markets. Finally, the logic of this comment suggests that HUD should change the FMR estimation process to a model-based forecast system derived from time-series-panel data on rents. Again, this methodology would only be valid for the largest metropolitan FMR areas where a highly reliable recent mover rent can be derived from ACS data. It is not clear that the model would be feasible and accurate for smaller FMR areas, nor how a model-based FMR estimate would accord with statutory language regarding FMR estimates.
Comment: The year-to-year volatility in FMRs has significant adverse impacts. A reduction of more than five percent in the published FMRs triggers a rent reasonableness analysis on the part of the PHA with jurisdiction over the area (Housing Choice Voucher Guidebook, directive 7420.10G). If the PHA's analysis finds that the rent being charged by a property owner is no longer reasonable, the owner will be required to reduce the rent. If the owner determines that this reduction will adversely affect the financial stability of the property, the owner will likely choose to leave the program, and the tenant will then have to move. Another consequence of a large reduction in FMRs is that owners may have to defer maintenance items because cash flows are no longer adequate to cover operating expenses. Alternatively, higher FMRs force the PHA with jurisdiction over the area to increase their payment standards and serve far fewer families within the community. This is detrimental at a time when PHAs are already stretching the limited amount of funding received from HUD to help as many families as they can. Increased FMRs will increase the waiting list for the HCV program and will increase the homeless population for an area.
FMRs cannot decrease in economic growth areas; some of these areas cannot manage the voucher program even with modest FMR increases. Several comments, even pertaining to FMR areas with decreases below five percent, or with modest increases, pressed for higher FY 2016 FMRs. Some of these areas had very tight markets and some of these areas already used payment standards at 110 percent of the FMRs. One commenter protested the retroactive effective date of October 1, 2015, which would not provide the time required to adjust payment standards.
HUD Response: The FMRs are effective when published. To help manage the HCV program and mitigate the impact of FMR decreases, PHAs may be able to: (1) Use Success Rate Payment Standards 24 CFR 982.503(e); or (2) request Exception Payment Standards for subareas within a FMR area (not to exceed 50 percent of the population) at 24 CFR 982.503(c).
Comment: Vacancy rates are low, making it impossible to absorb FMR decreases. Several comments stated that low or no vacancy rates in areas with increased economic activity require higher FMRs so that voucher tenants can compete for housing. In these areas, there is not sufficient rental housing and generally, the 2013 rental data from the ACS does not reflect this situation.
HUD Response: When a market tightens rapidly, the FMRs cannot keep pace. The most accurate, statistically reliable data available to HUD is lagged by two years. Even if HUD conducts surveys of these areas, capturing the full scope of rent increases is difficult if the market condition has been occurring for less than two years; furthermore, it is challenging to get valid results for surveys of relatively small housing markets (with population under 1,000 persons). Most of the areas suffering from very rapidly tightening market conditions meet one or both of these criteria. Areas with sustained extremely low vacancy rates require construction of additional units. Higher FMR levels will not necessarily encourage additional development. These areas may use Exception Payment Standards for subareas within an FMR area (not to exceed 50 percent of the population) as described at 24 CFR 982.503(c), or Success Rate Payment Standards available at 24 CFR 982.503(e) to alleviate market pressures, or in severely disrupted rental markets.
Comment: FY 2016 FMR decreases reduce the ability of families to find affordable housing. Several comments stated that FMR decreases make it harder for tenants to find affordable housing, so HUD should not implement FMR decreases. The decrease in FMRs from FY 2015 to FY 2016 will reduce the availability of affordable housing in the area; landlords will be able to get higher rents from tenants that are not Section 8 voucher holders and so many will opt out of the program.
HUD Response: FMRs must reflect the most current statistically valid data and this means that FMRs cannot be held harmless (not allowed to decrease) when this data shows a decline. Most of the declines in the FMRs are based on lower 2013 rents, and in a few cases the 2013 to 2014 CPI adjustment reflects a decline.
Comment: FY 2016 FMR decreases will require existing tenants to pay a greater share of their income on rents. Several comments stated that their current tenants will have to pay a greater share of their income on rents, with FMR decreases.
HUD Response: New tenants are not allowed to pay more than 40 percent of their income on rent. Existing tenants will not have to pay rent based on reduced FMRs until the second anniversary of their Housing Assistance Payment (HAP) contract. If tenant rent Start Printed Page 77132burden increases for an area, PHAs may use this as a justification for higher payment standards.
Comment: Disabled and difficult-to-place residents suffer a disproportionately greater impact from FMR decreases because they have fewer housing choice options. Disabled residents already have fewer units available to them, and reducing the FMR will further reduce their options. Difficult to place residents, because of a history of late payments or other issues, will have fewer landlords willing to rent to them if the FMR is lower.
HUD Response: HUD must use the most current data available and rents may increase and decrease. The data used as the basis for FY 2016 FMRs is more current than what was available in the estimation of the FMRs for FY 2015. The rent and utility data for the FY 2016 FMRs are more current than for the FY 2015 FMRs and are a better representation of the position in the rent distribution required by the FMR regulations. If a family has a member with a disability, a PHA may establish a higher payment standard for that family as a reasonable accommodation as discussed in 24 CFR 982.505(d).
Comment: HUD should institute caps and floors to limit annual FMR changes to five percent. A five percent change in the FMR triggers a rent reasonableness study, which is costly for cash-strapped PHAs. HUD should have instituted the same cap and floor of five percent that it instituted for Income Limits with the FY 2010 Income Limits.
HUD Response: HUD is constrained by legal and regulatory language for its calculation of FMRs. HUD cannot ignore the requirement that it use the most current data by implementing FMR changes in five percent increments. Statutory and regulatory changes are required before HUD would be able to implement any methodology changes that would limit the use of the most current rent data in setting FMRs. No such regulation or legislative requirement governs the calculation of income limits and prior to FY 2010, income limits were held harmless, that is, not allowed to ever decline. The change to incorporate caps and floors of up to five percent was a way to remove this hold harmless policy and create parity with increases and decreases.
Comment: HUD should provide flexibility concerning the implementation of the FY 2016 FMRs and provide a 3-month delay similar to the implementation of changes in the determination of Public Housing Flat Rents. HUD should allow Housing Authorities a 90-day grace period from HUD's publication of final FY 2016 FMRs before any PHA revised voucher payment standards would affect voucher-assisted households' rent shares or Total Tenant Payment (TTP) as of January 1, 2016.
HUD Response: Program counsel for the HCV program reviewed this comment and revisited the statutory language governing FMRs. The plain language interpretation of the statute is that FMRs become effective upon publication in final form in the Federal Register and does not afford the implementation flexibility requested in the comment.
VIII. Rental Housing Surveys
In 2011, HUD solicited bidders to study the methodology used to conduct local area surveys of gross rents to determine if the Random Digit Dialing (RDD) methodology could be improved upon. The Department undertook this study due to the increasing costs and declining response rates associated with telephone surveys. Furthermore, the advent of the one-year ACS limits the need for surveys in large metropolitan areas. Based on this research, the Department decided that its survey methodology should be changed with mail surveys being the preferred method for conducting surveys, because of the lower cost and greater likelihood of survey responses. These surveys, however, take almost twice as long to conduct as prior survey methods took, and when response times are most critical, the Department may choose to conduct random digit dialing surveys as well, as the budget permits. Unfortunately, the anticipated budget does not permit HUD to conduct any surveys in FY 2016. The methodology for both types of surveys along with the survey instruments is posted on the HUD USER Web site, at the bottom of the FMR page in the section labeled “Fair Market Rent Surveys” at: http://www.huduser.gov/portal/datasets/fmr.html.
Other survey methodologies are acceptable in providing data to support comments if the survey methodology can provide statistically reliable, unbiased estimates of the gross rent. Survey samples should be randomly drawn from a complete list of rental units for the FMR area. If this is not feasible, the selected sample must be drawn to be statistically representative of the entire rental housing stock of the FMR area. Surveys must include units at all rent levels and be representative of structure type (including single-family, duplex, and other small rental properties), age of housing unit, and geographic location. The 2009-2013 five-year ACS data should be used as a means of verifying if a sample is representative of the FMR area's rental housing stock.
Most surveys cover only one- and two-bedroom units, which has statistical advantages because these are generally the most abundant rental units in an area. However in nonmetropolitan areas and some metropolitan areas, three-bedroom units are also surveyed because there are significant rental units at this size in the FMR area. If the survey is statistically acceptable, HUD will estimate FMRs for other bedroom sizes using the new ratios based on an average of 2007-2011, 2008-2012, and 2009-2013 five-year ACS data. A PHA or contractor that cannot obtain the recommended number of sample responses after reasonable efforts should consult with HUD before abandoning its survey; in such situations, HUD may find it appropriate to relax normal sample size requirements.
HUD will consider increasing manufactured home space FMRs where public comment demonstrates that 40 percent of the two-bedroom FMR is not adequate. In order to be accepted as a basis for revising the manufactured home space FMRs, comments must include a pad rental survey of all mobile home parks in the FMR area, identify the utilities included in each park's rental fee, and provide a copy of the applicable public housing authority's utility schedule.
As stated earlier in this Notice, HUD is required to use the most recent data available when calculating FMRs. Therefore, in order to re-evaluate an area's FMR, HUD requires more current rental market data than the 2013 ACS.
IX. Environmental Impact
This Notice involves the establishment of fair market rent schedules, which do not constitute a development decision affecting the physical condition of specific project areas or building sites. Accordingly, under 24 CFR 50.19(c)(6), this Notice is categorically excluded from environmental review under the National Environmental Policy Act of 1969 (42 U.S.C. 4321).
Accordingly, the Fair Market Rent Schedules, which will not be codified in 24 CFR part 888, are proposed to be amended as shown in the Appendix to this notice:
Start SignatureStart Printed Page 77133End SignatureDated: December 8, 2015.
Katherine M. O'Regan,
Assistant Secretary for Policy Development and Research.
Fair Market Rents for the Housing Choice Voucher Program
Schedules B and D—General Explanatory Notes
1. Geographic Coverage
a. Metropolitan Areas—Most FMRs are market-wide rent estimates that are intended to provide housing opportunities throughout the geographic area in which rental-housing units are in direct competition. HUD is using the metropolitan CBSAs, which are made up of one or more counties, as defined by the Office of Management and Budget (OMB), with some modifications. HUD is generally assigning separate FMRs to the component counties of CBSA Micropolitan Areas.
b. Modifications to OMB Definitions—Following OMB guidance, the estimation procedure for the FY 2016 FMRs incorporates the OMB definitions of metropolitan areas based on the CBSA standards as implemented with 2000 Census data and updated by the 2010 Census in February 23, 2013. The adjustments made to the 2000 definitions to separate subparts of these areas where FMRs or median incomes would otherwise change significantly are continued. To follow HUDs policy of providing FMRs at the smallest possible area of geography, no counties were added to existing metropolitan areas. All counties added to metropolitan areas will still be treated as separate counties. New multicounty metropolitan areas are not subdivided. All metropolitan areas that have at least one subarea will also receive a subarea, that is the rents from a county that is a subarea will not be used for the remaining metropolitan subarea rent determination. The specific counties and New England towns and cities within each state in MSAs and HMFAs were not changed by the February 28, 2013 OMB metropolitan area definitions. These areas are listed in Schedule B.
2. Unit Bedroom Count Adjustments
Schedule B shows the FMRs for zero-bedroom through four-bedroom units. The Schedule B addendum shows Small Area FMRs for all PHAs operating using Small Area FMRs. The FMRs for unit sizes larger than four bedrooms are calculated by adding 15 percent to the four-bedroom FMR for each extra bedroom. For example, the FMR for a five-bedroom unit is 1.15 times the four-bedroom FMR, and the FMR for a six-bedroom unit is 1.30 times the four-bedroom FMR. FMRs for single-room-occupancy (SRO) units are 0.75 times the zero-bedroom FMR.
3. Arrangement of FMR Areas and Identification of Constituent Parts
a. The FMR areas in Schedule B are listed alphabetically by metropolitan FMR area and by nonmetropolitan county within each state. The exception FMRs for manufactured home spaces in Schedule D are listed alphabetically by state.
b. The constituent counties (and New England towns and cities) included in each metropolitan FMR area are listed immediately following the listings of the FMR dollar amounts. All constituent parts of a metropolitan FMR area that are in more than one state can be identified by consulting the listings for each applicable state.
c. Two nonmetropolitan counties are listed alphabetically on each line of the non-metropolitan county listings.
d. The New England towns and cities included in a nonmetropolitan county are listed immediately following the county name.
Start Printed Page 77134
Start Printed Page 77135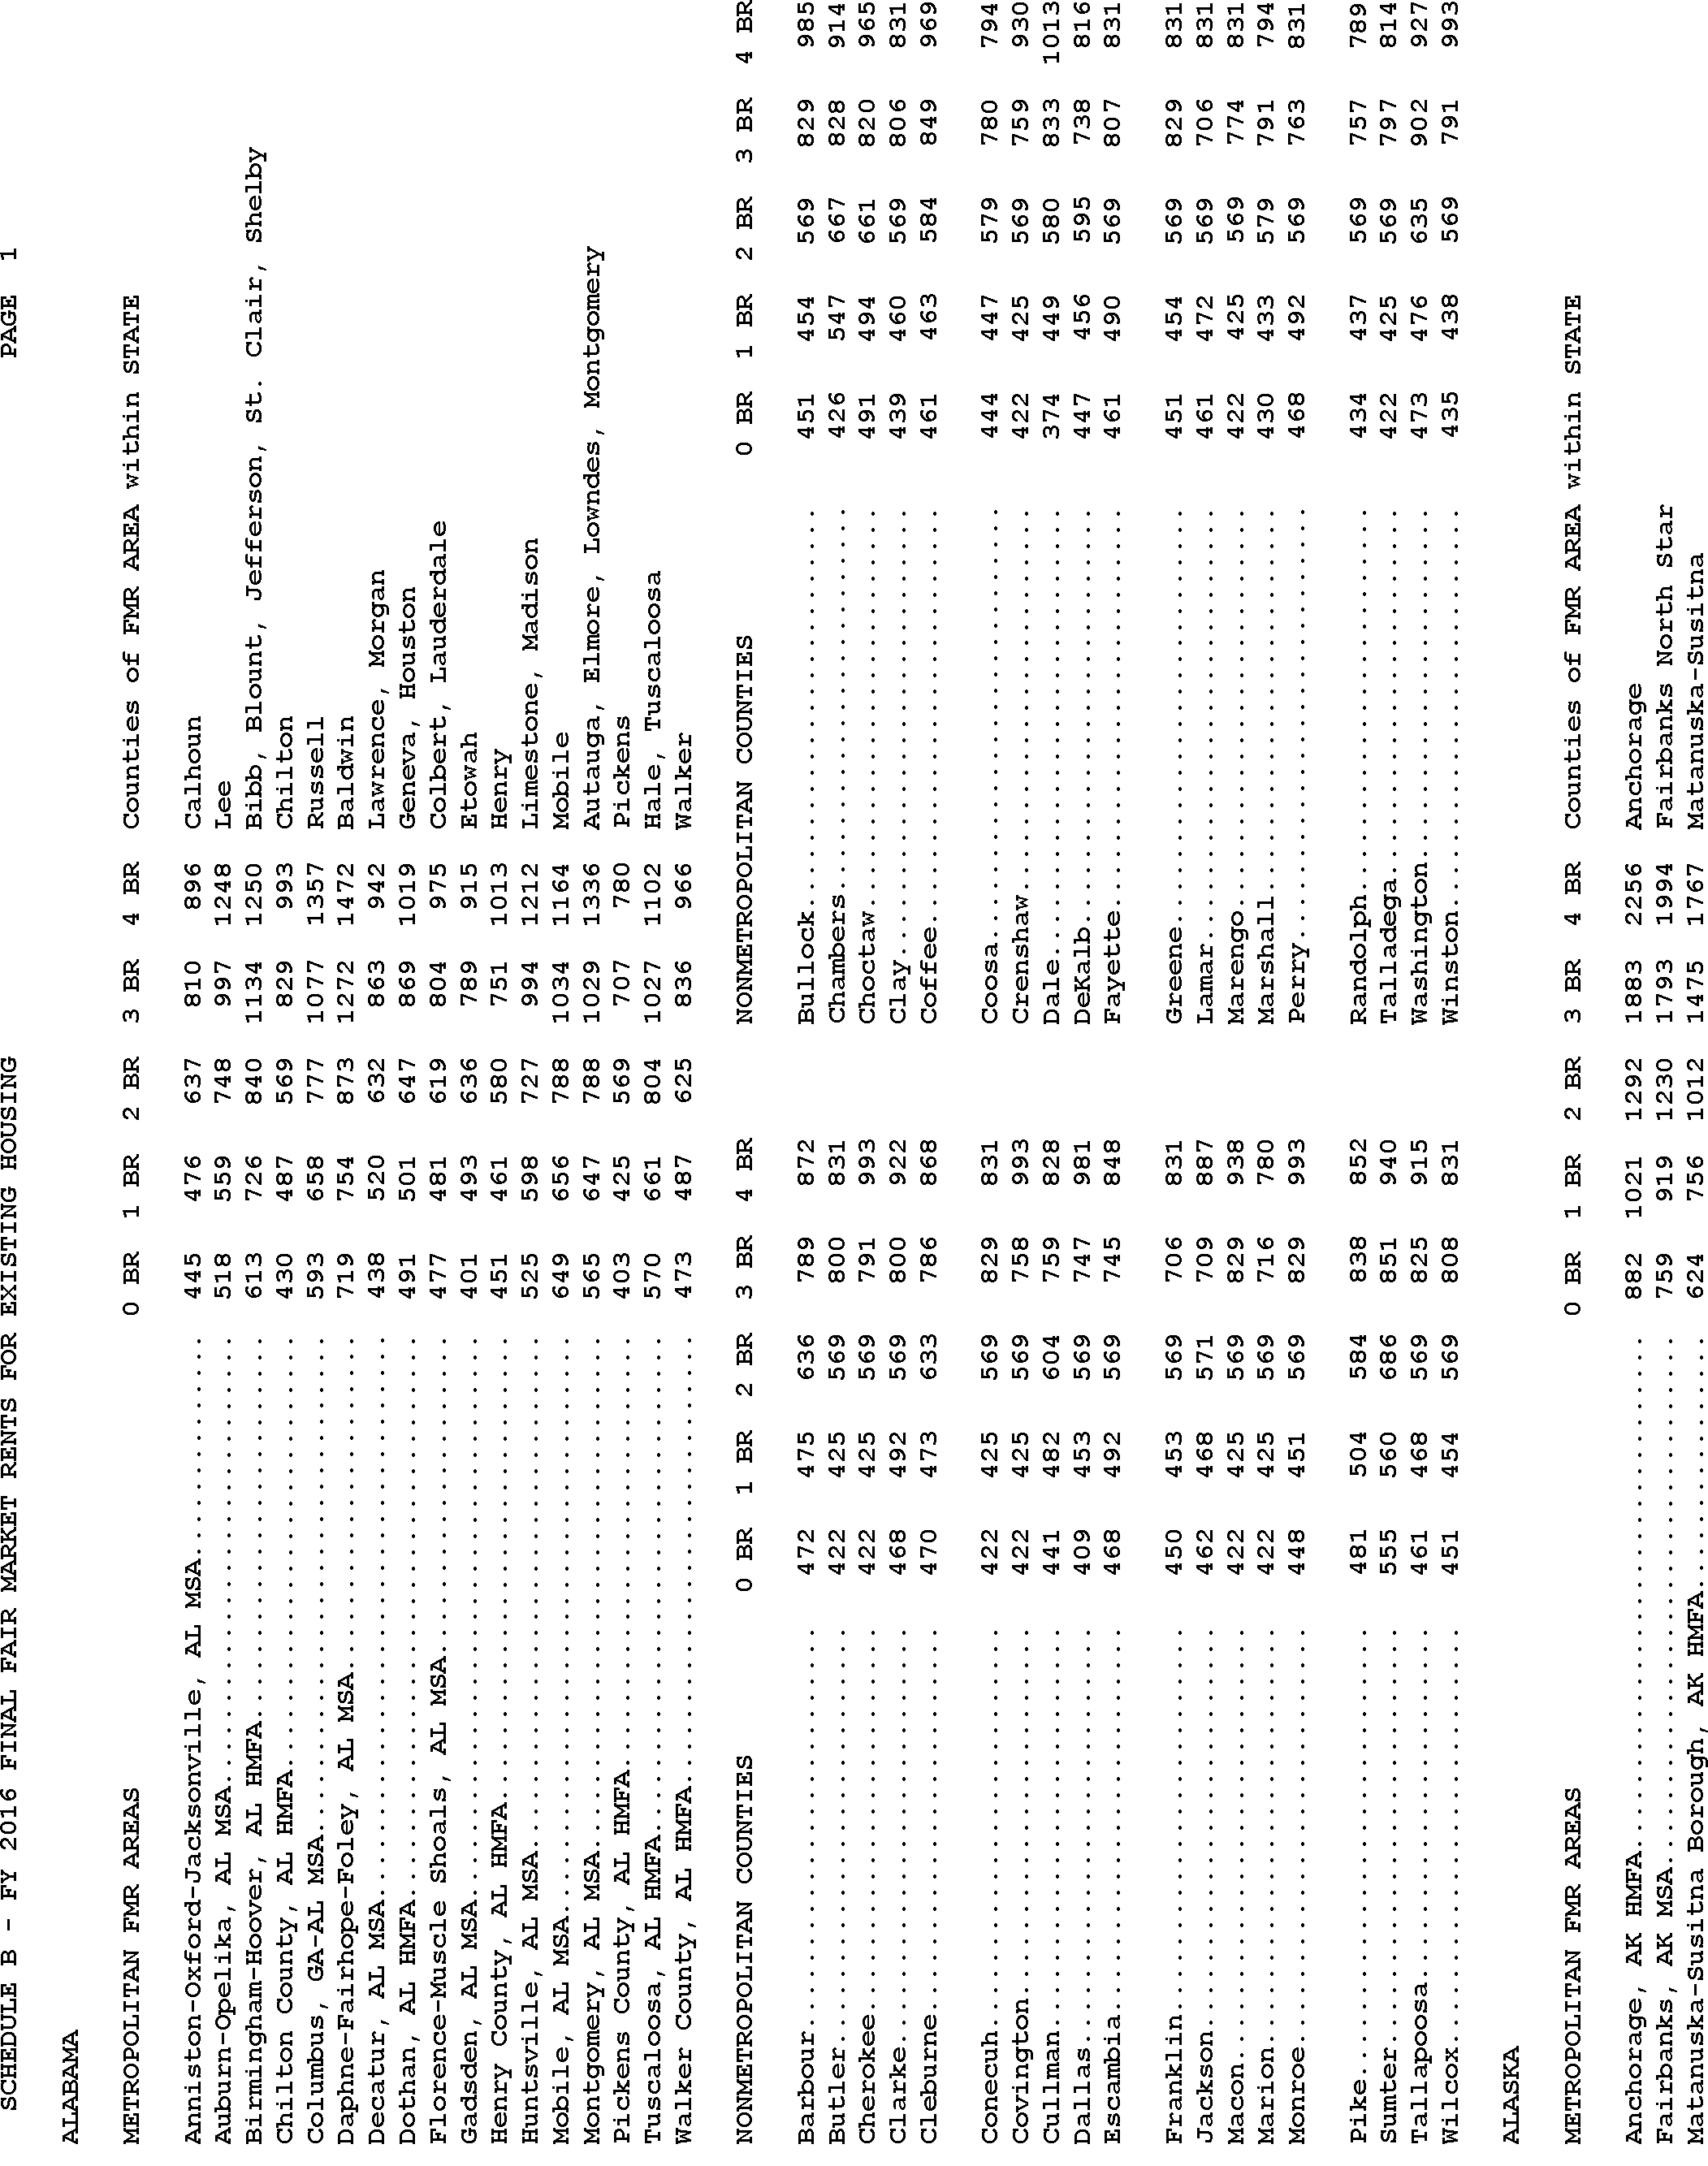
Start Printed Page 77136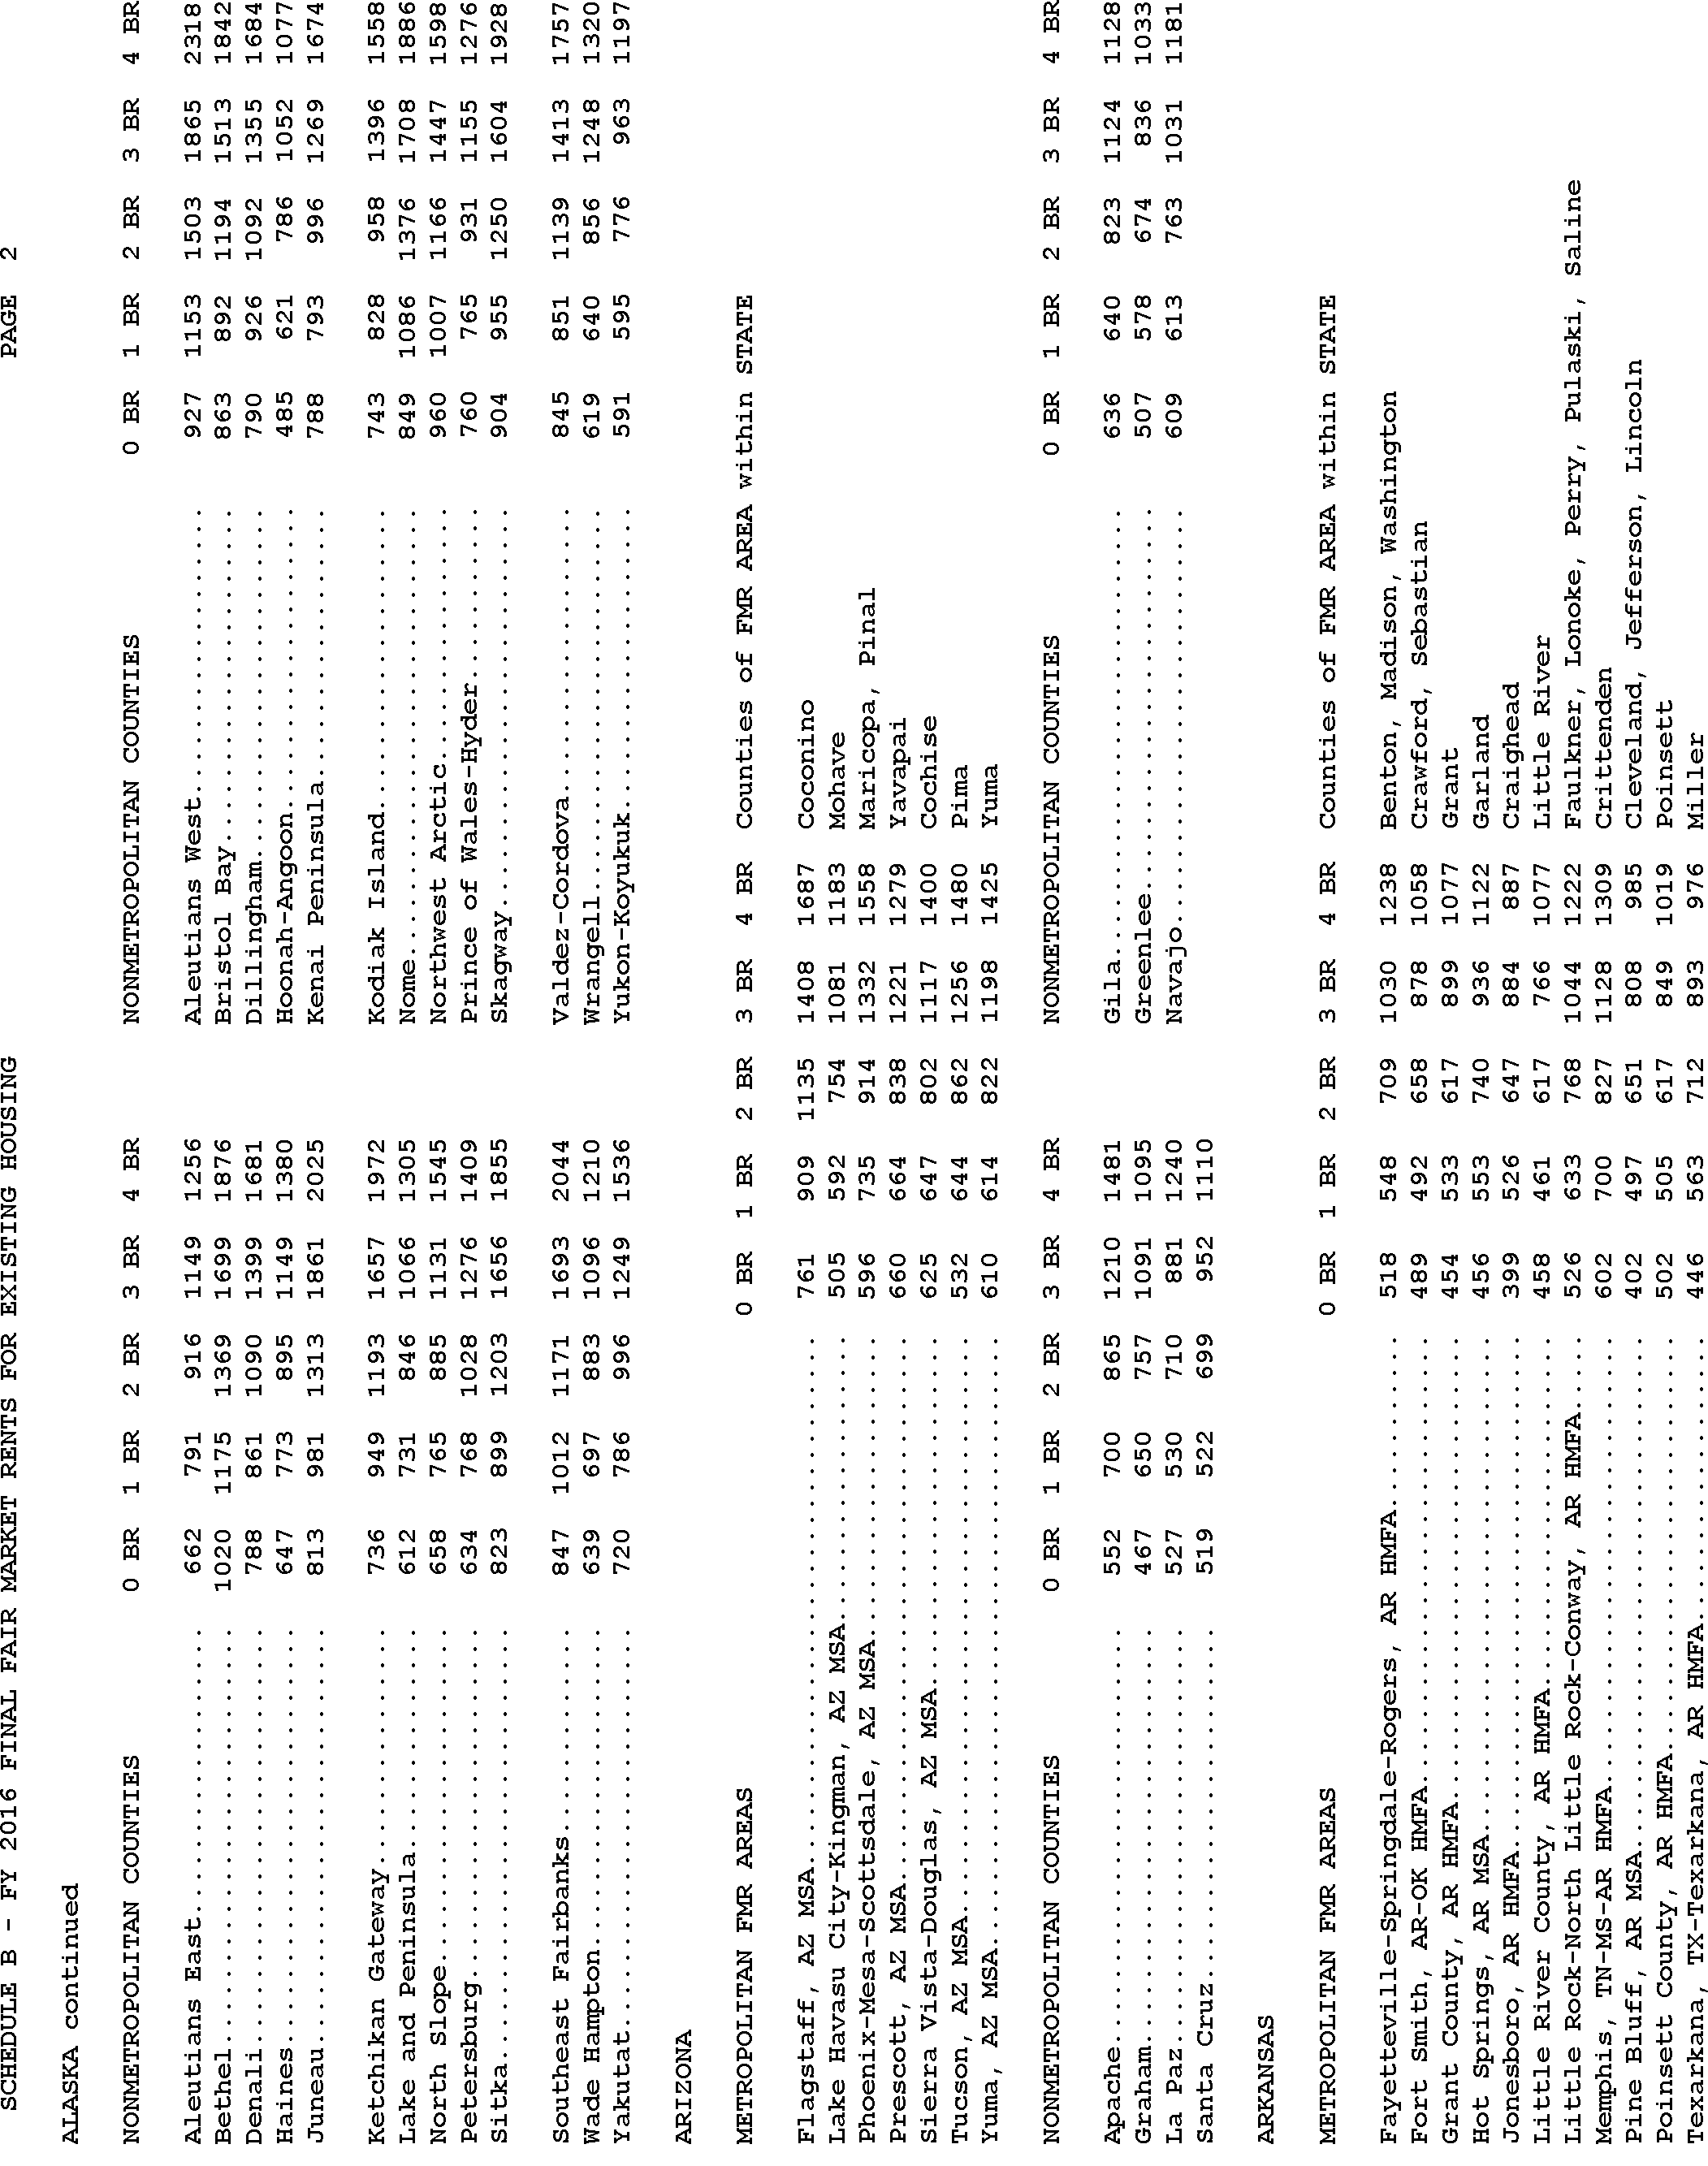
Start Printed Page 77137
Start Printed Page 77138
Start Printed Page 77139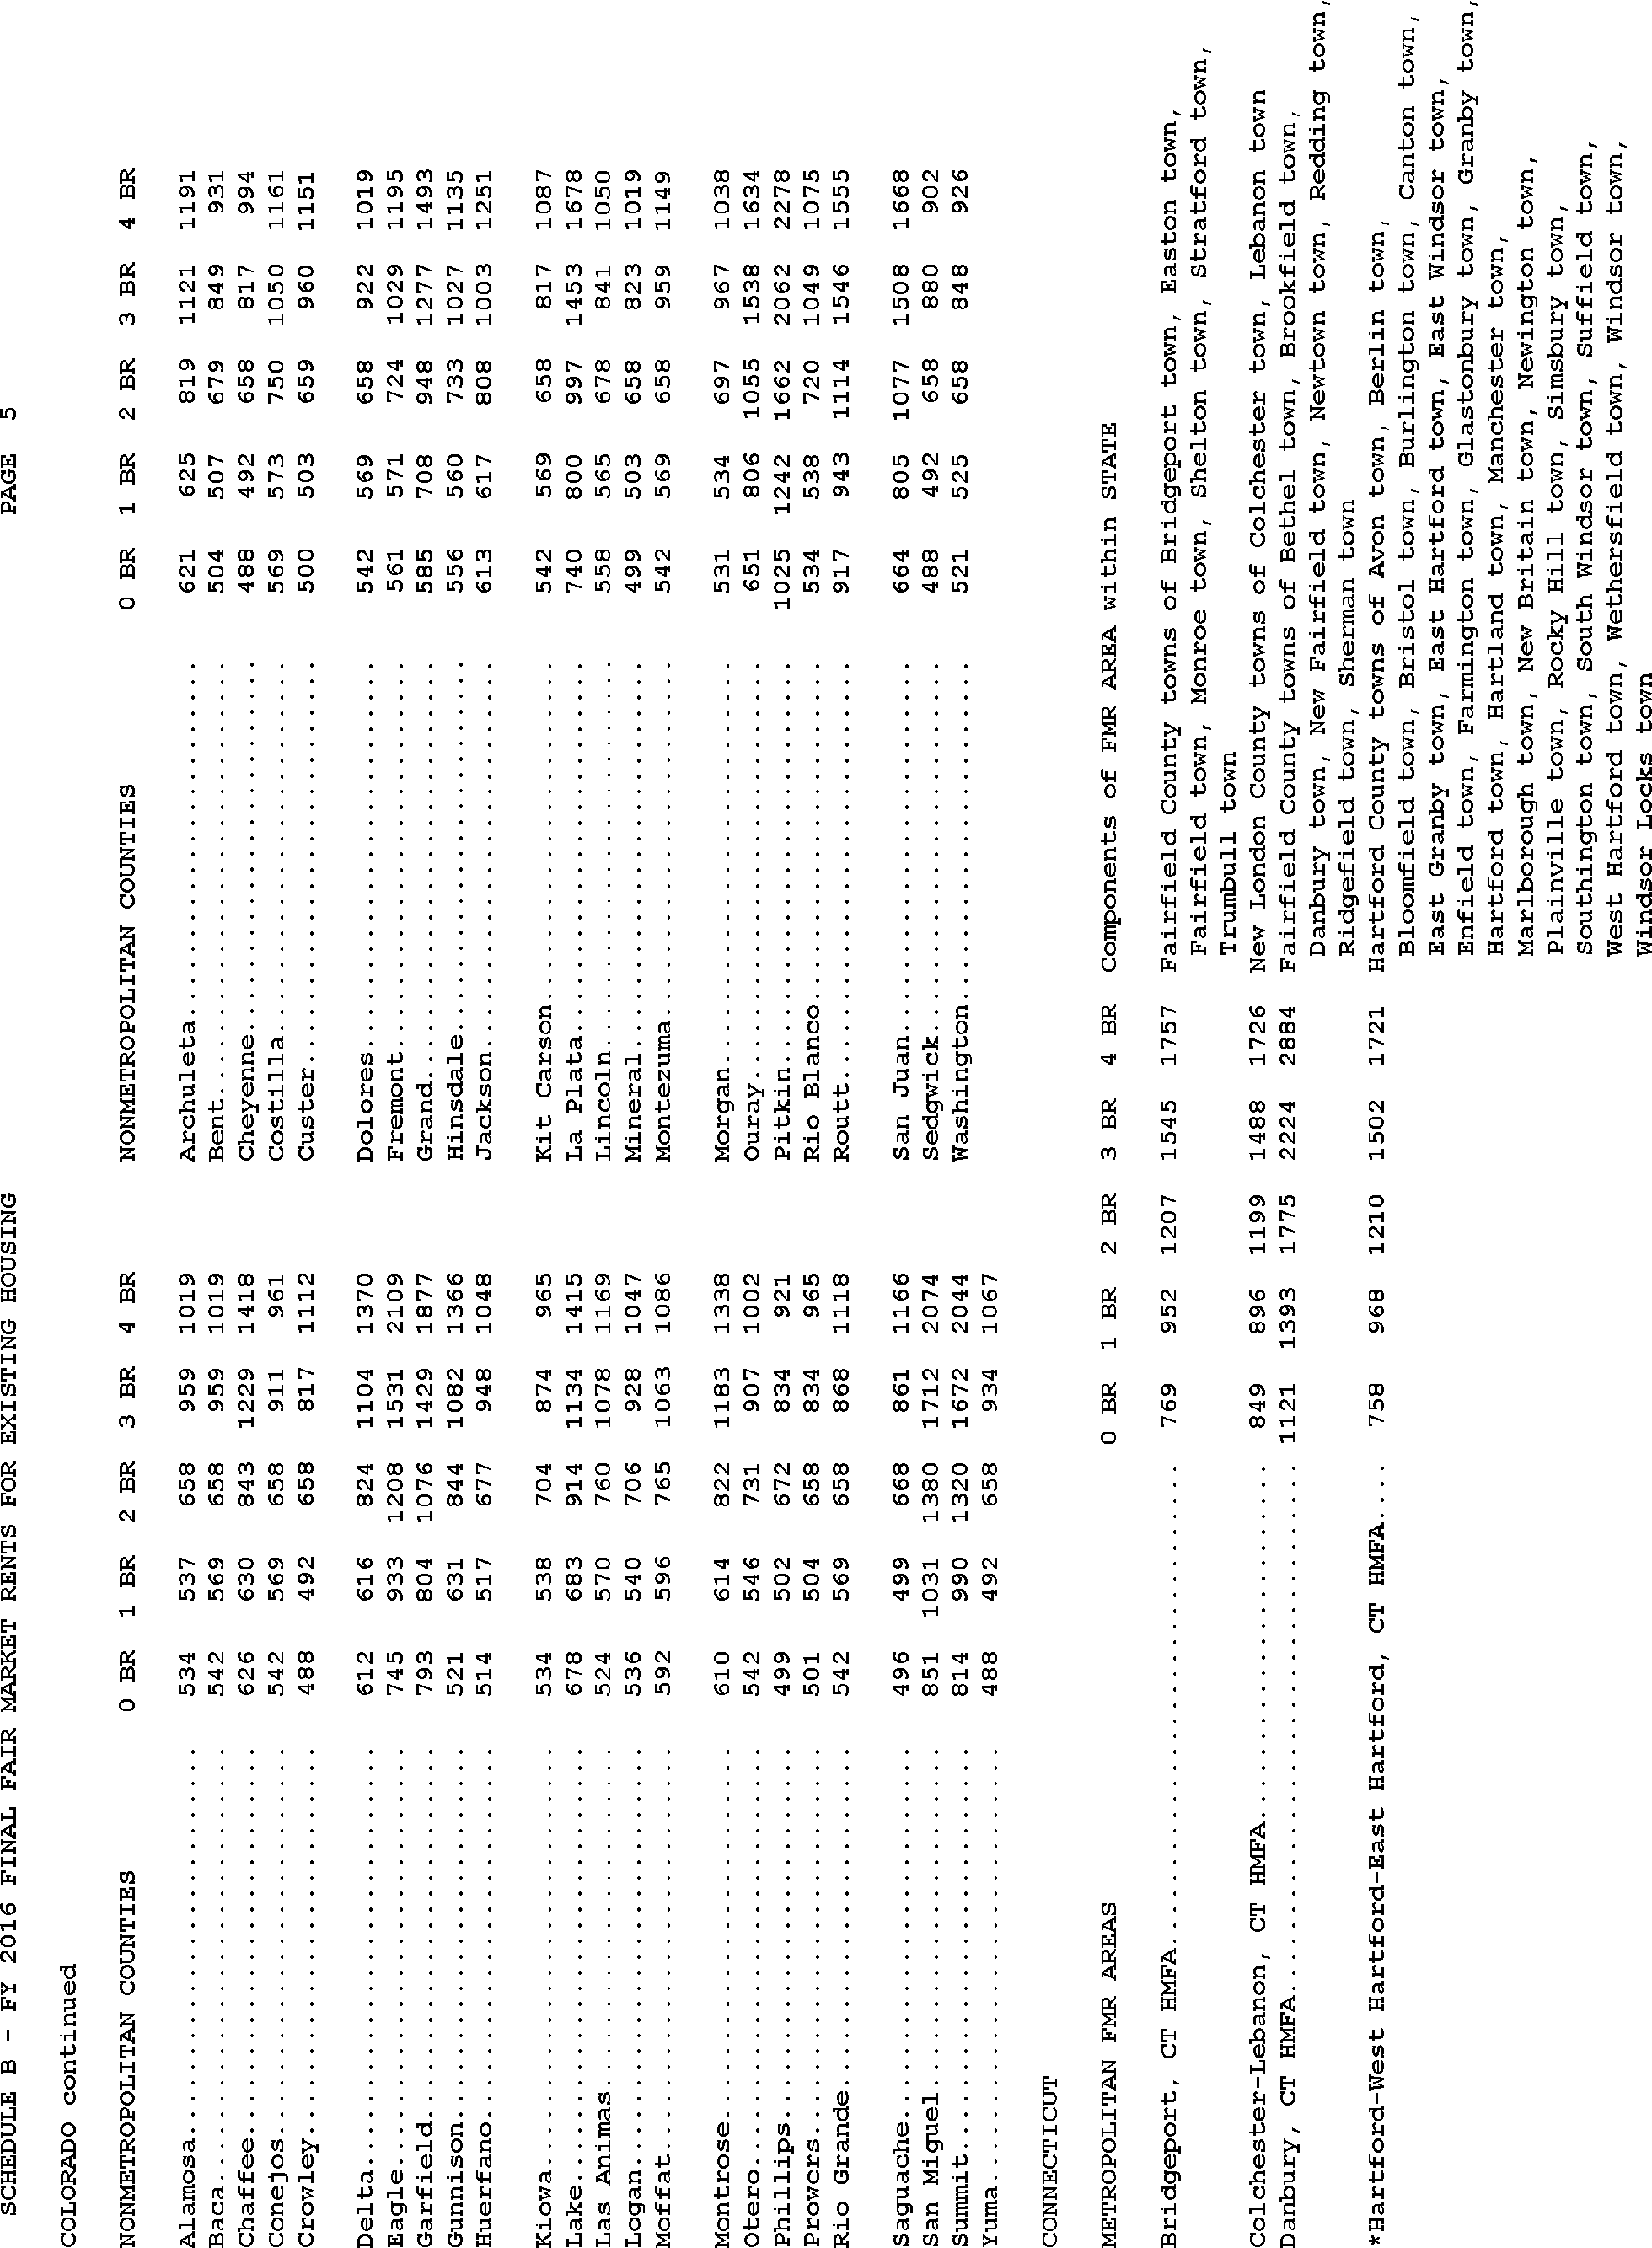
Start Printed Page 77140
Start Printed Page 77141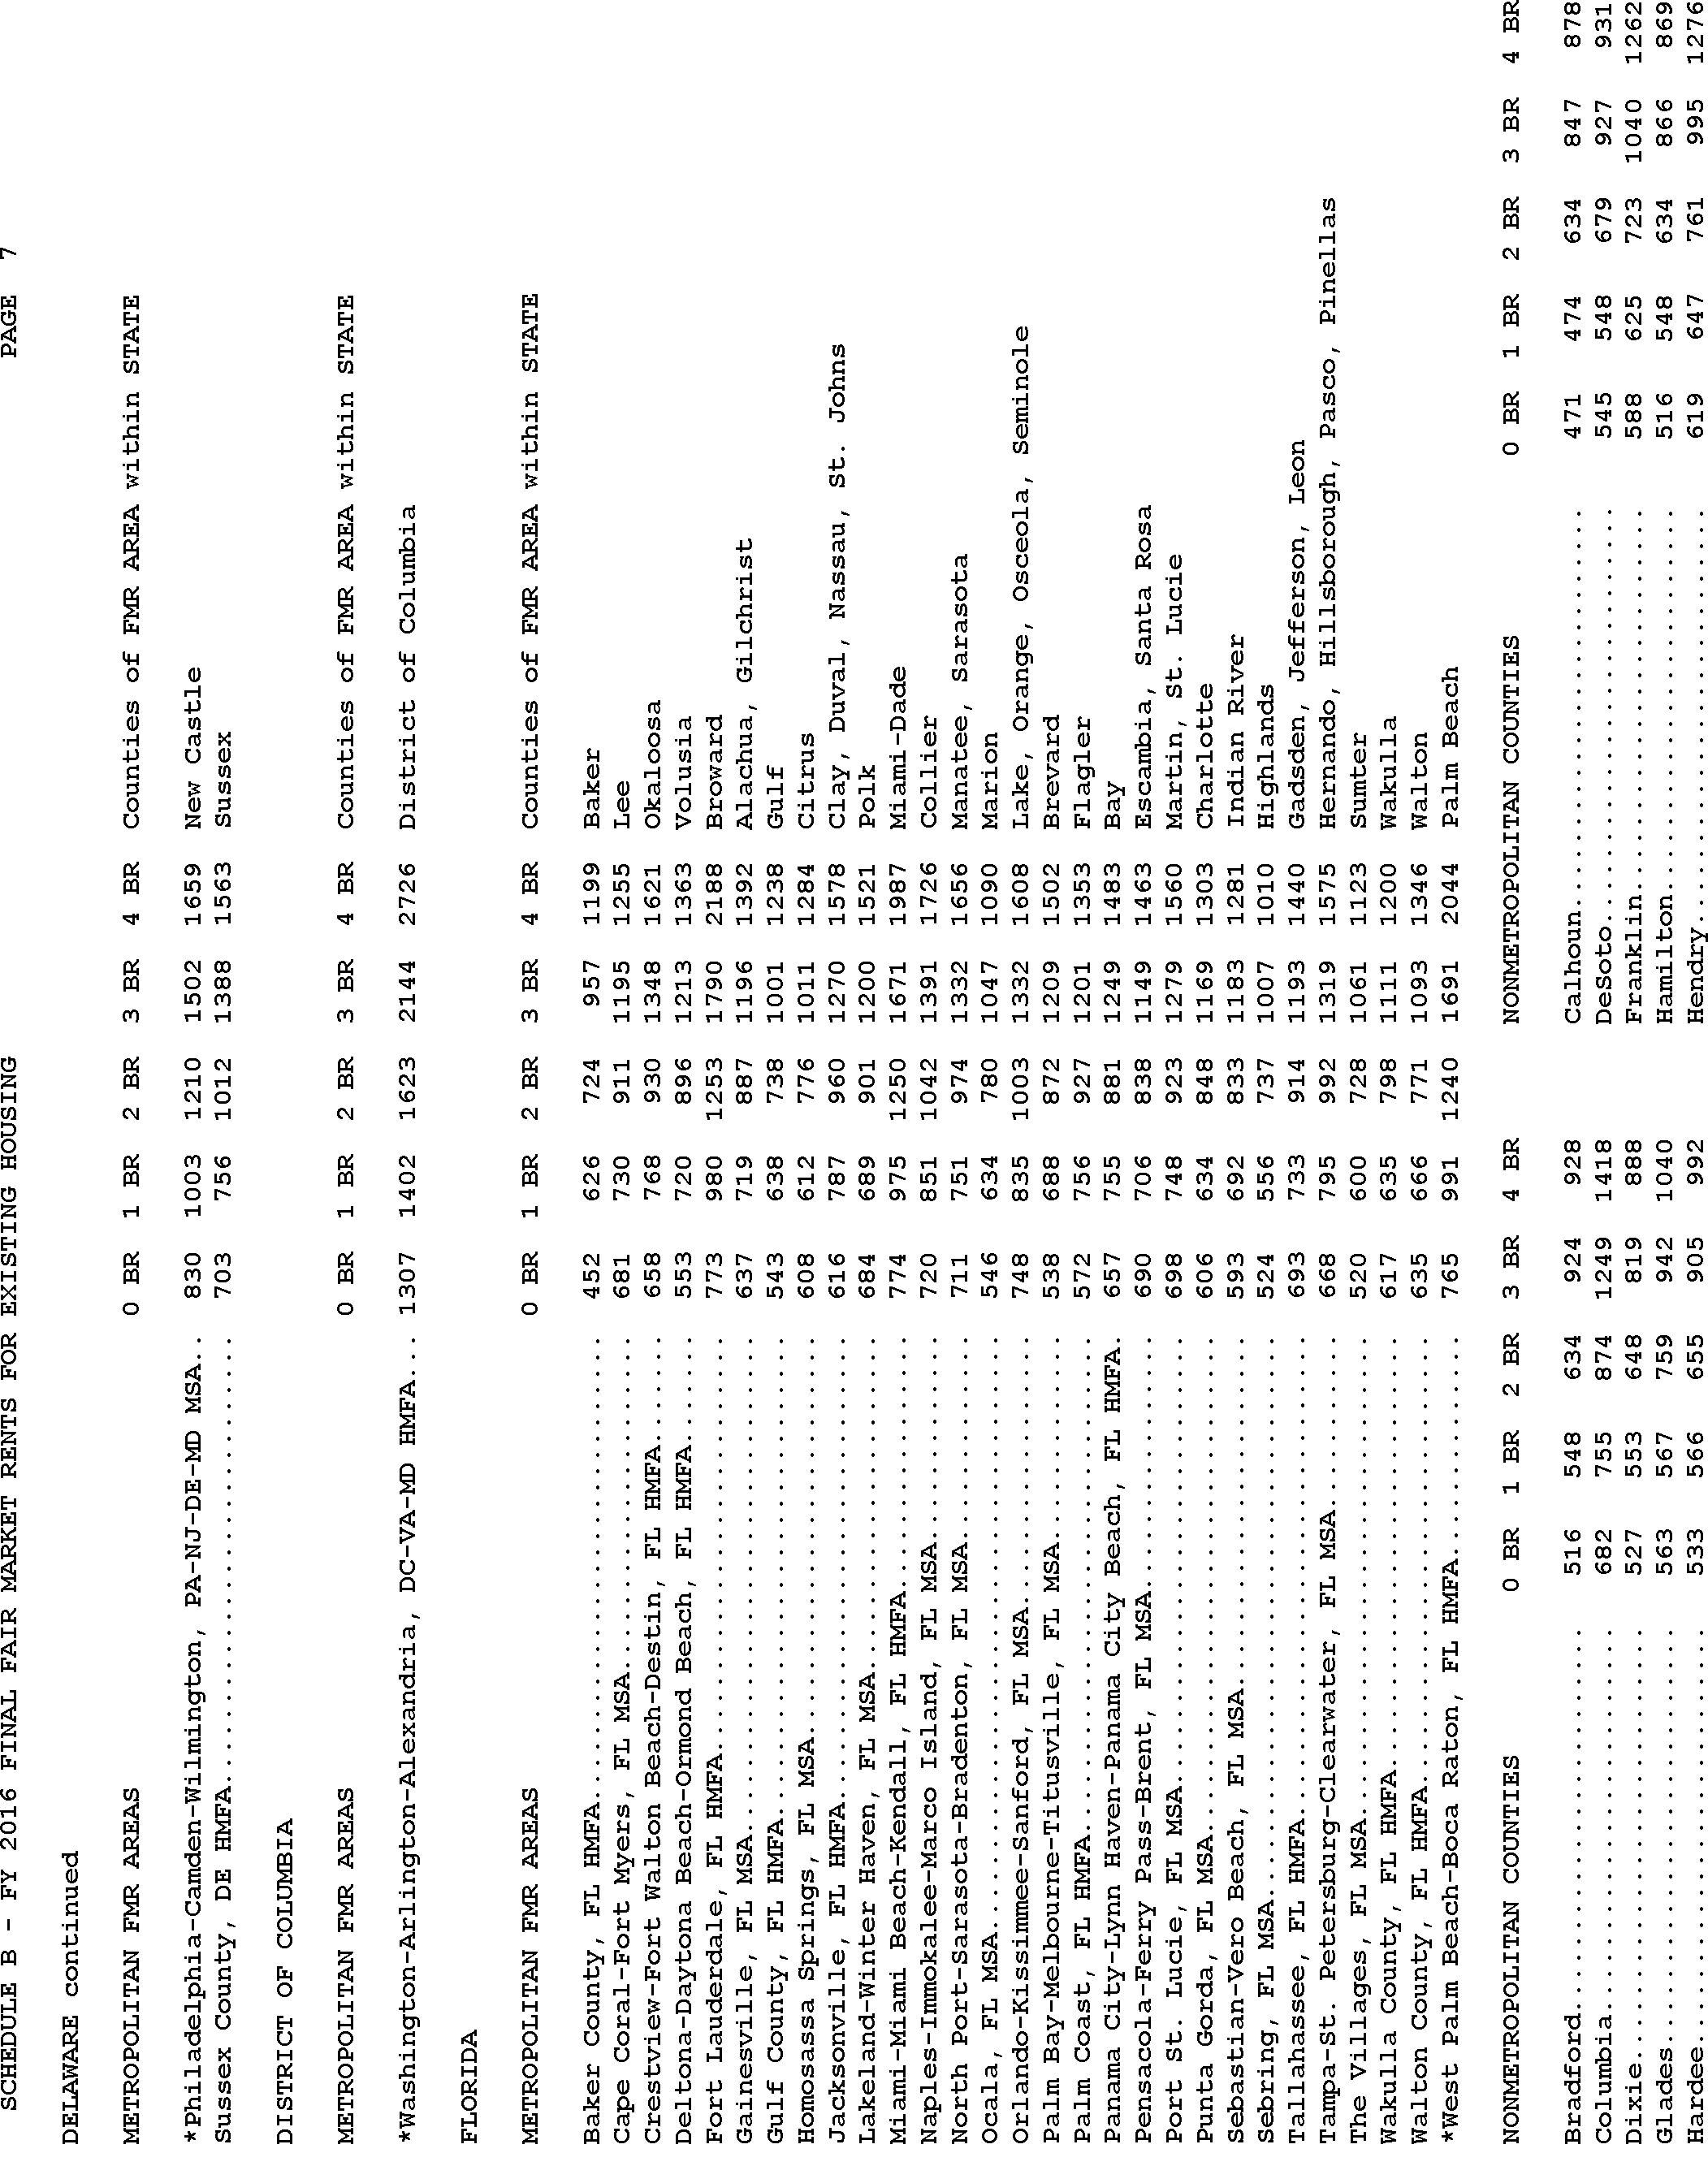
Start Printed Page 77142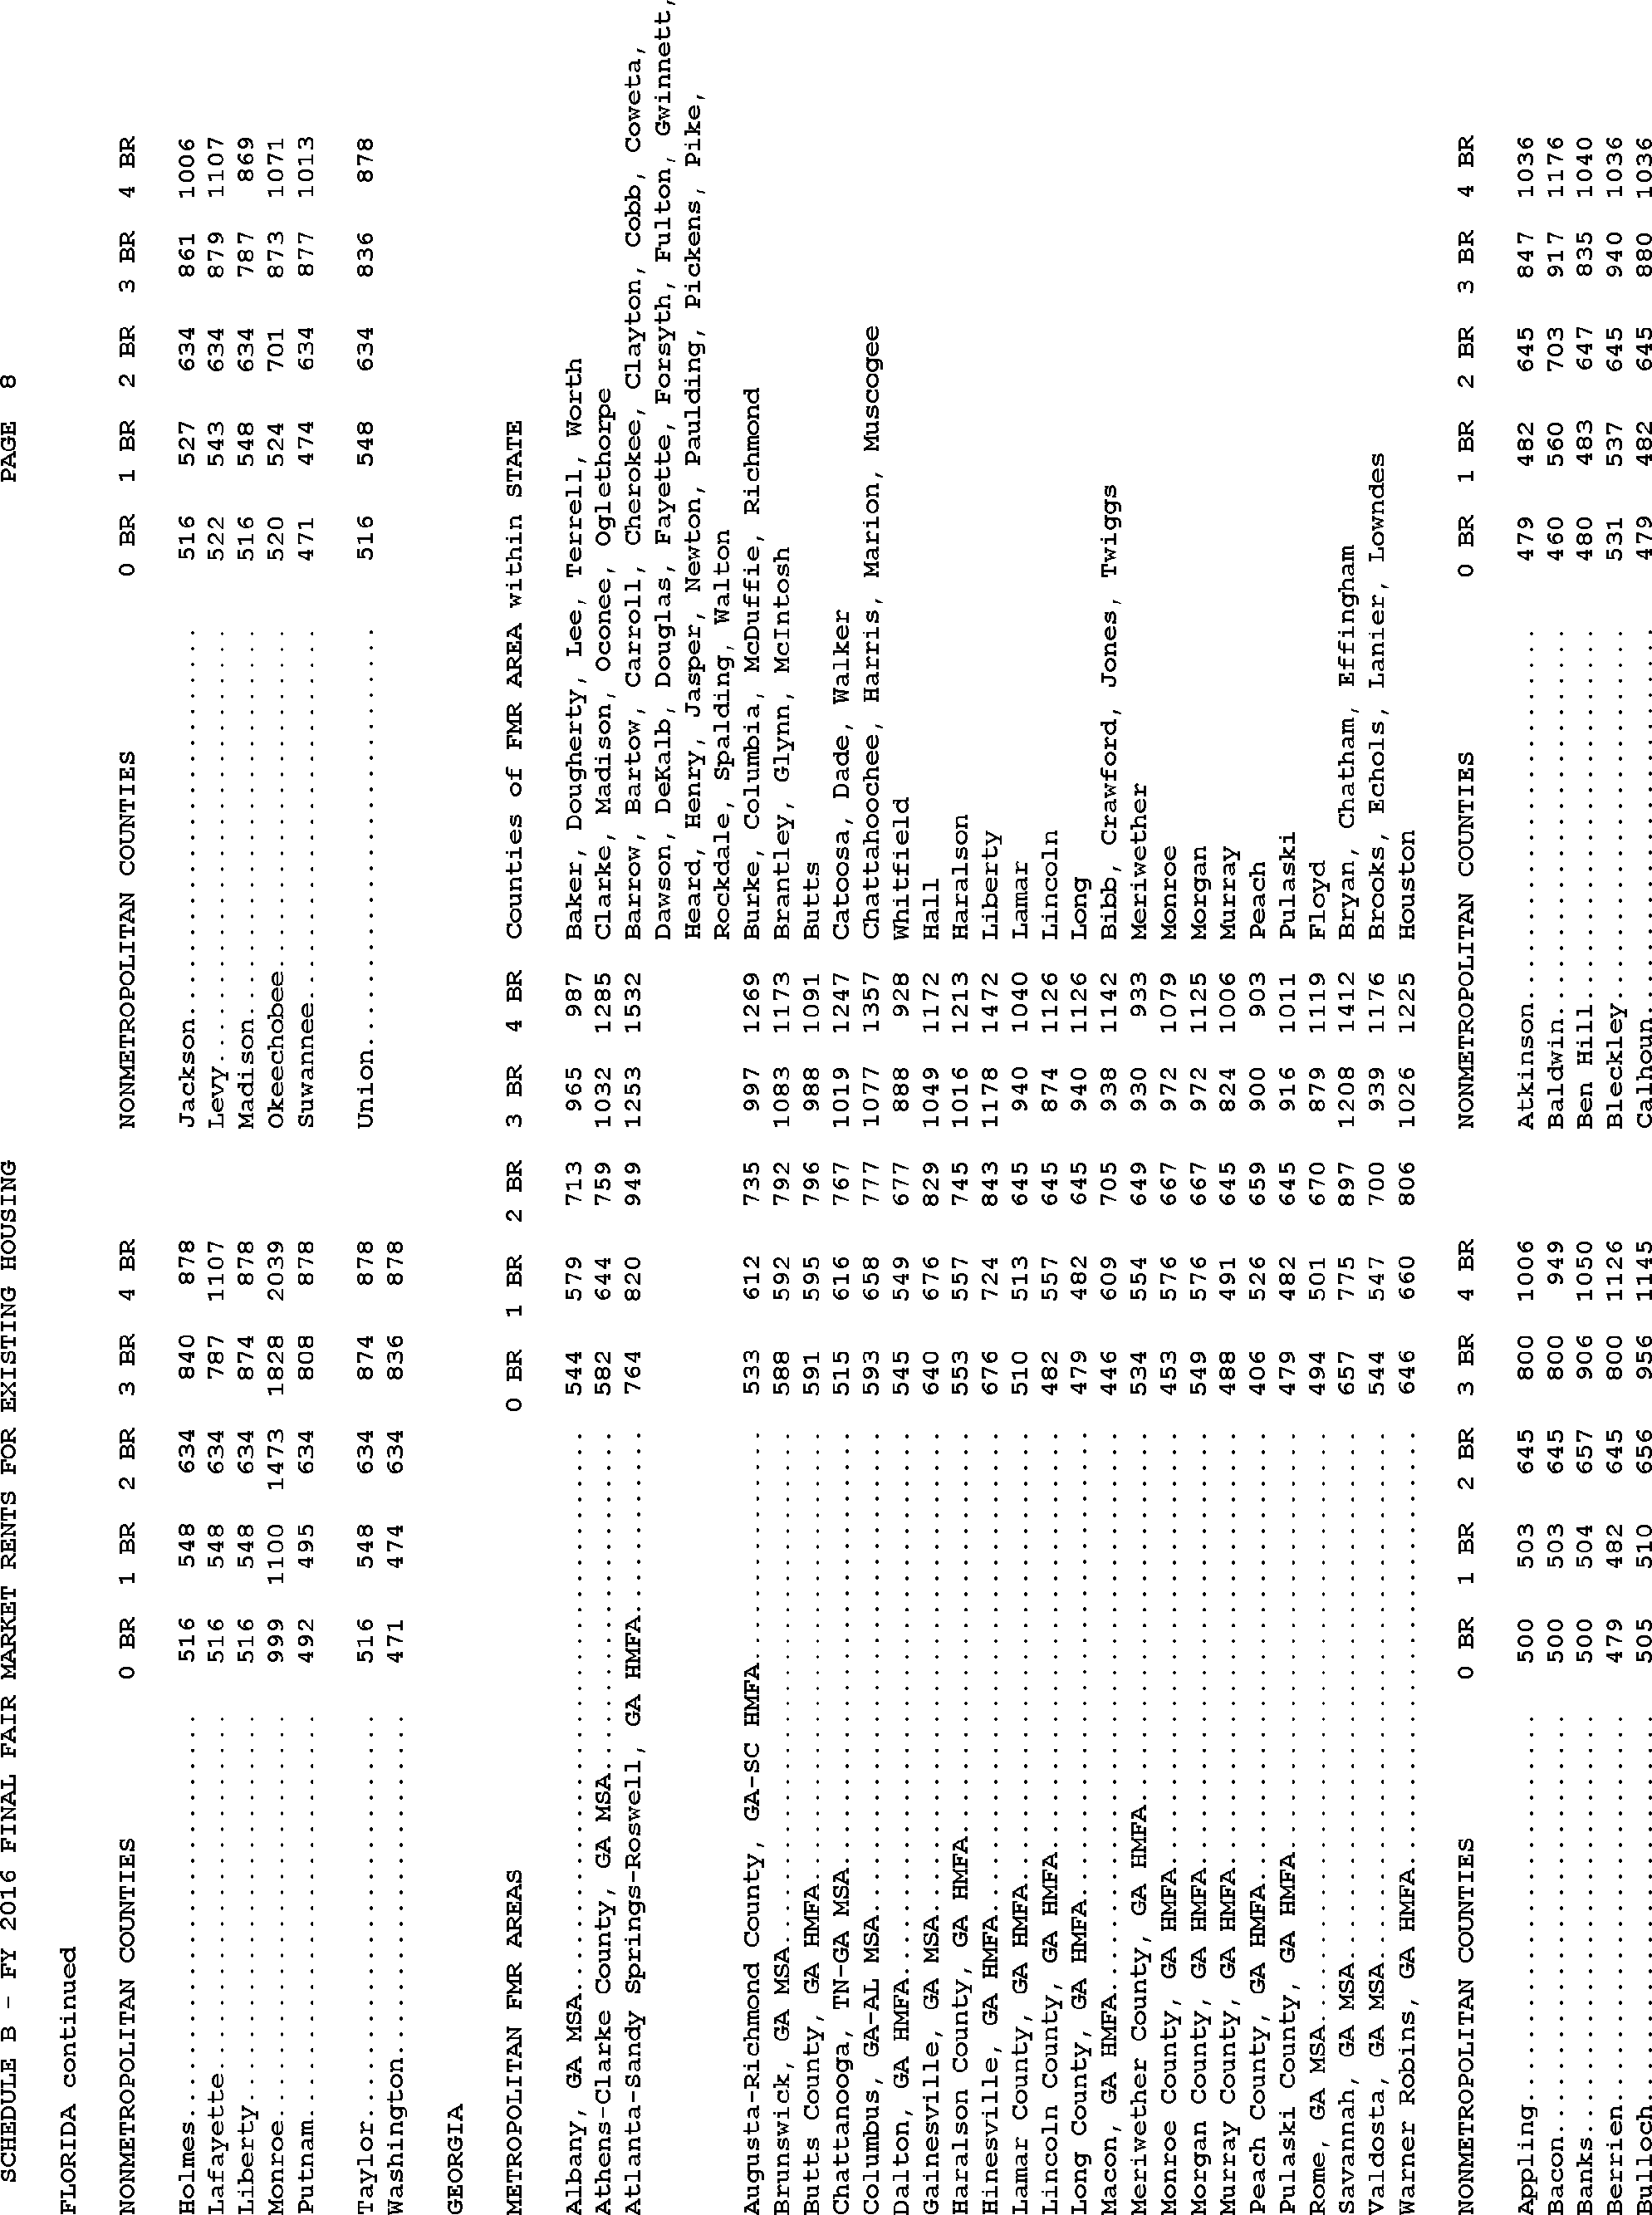
Start Printed Page 77143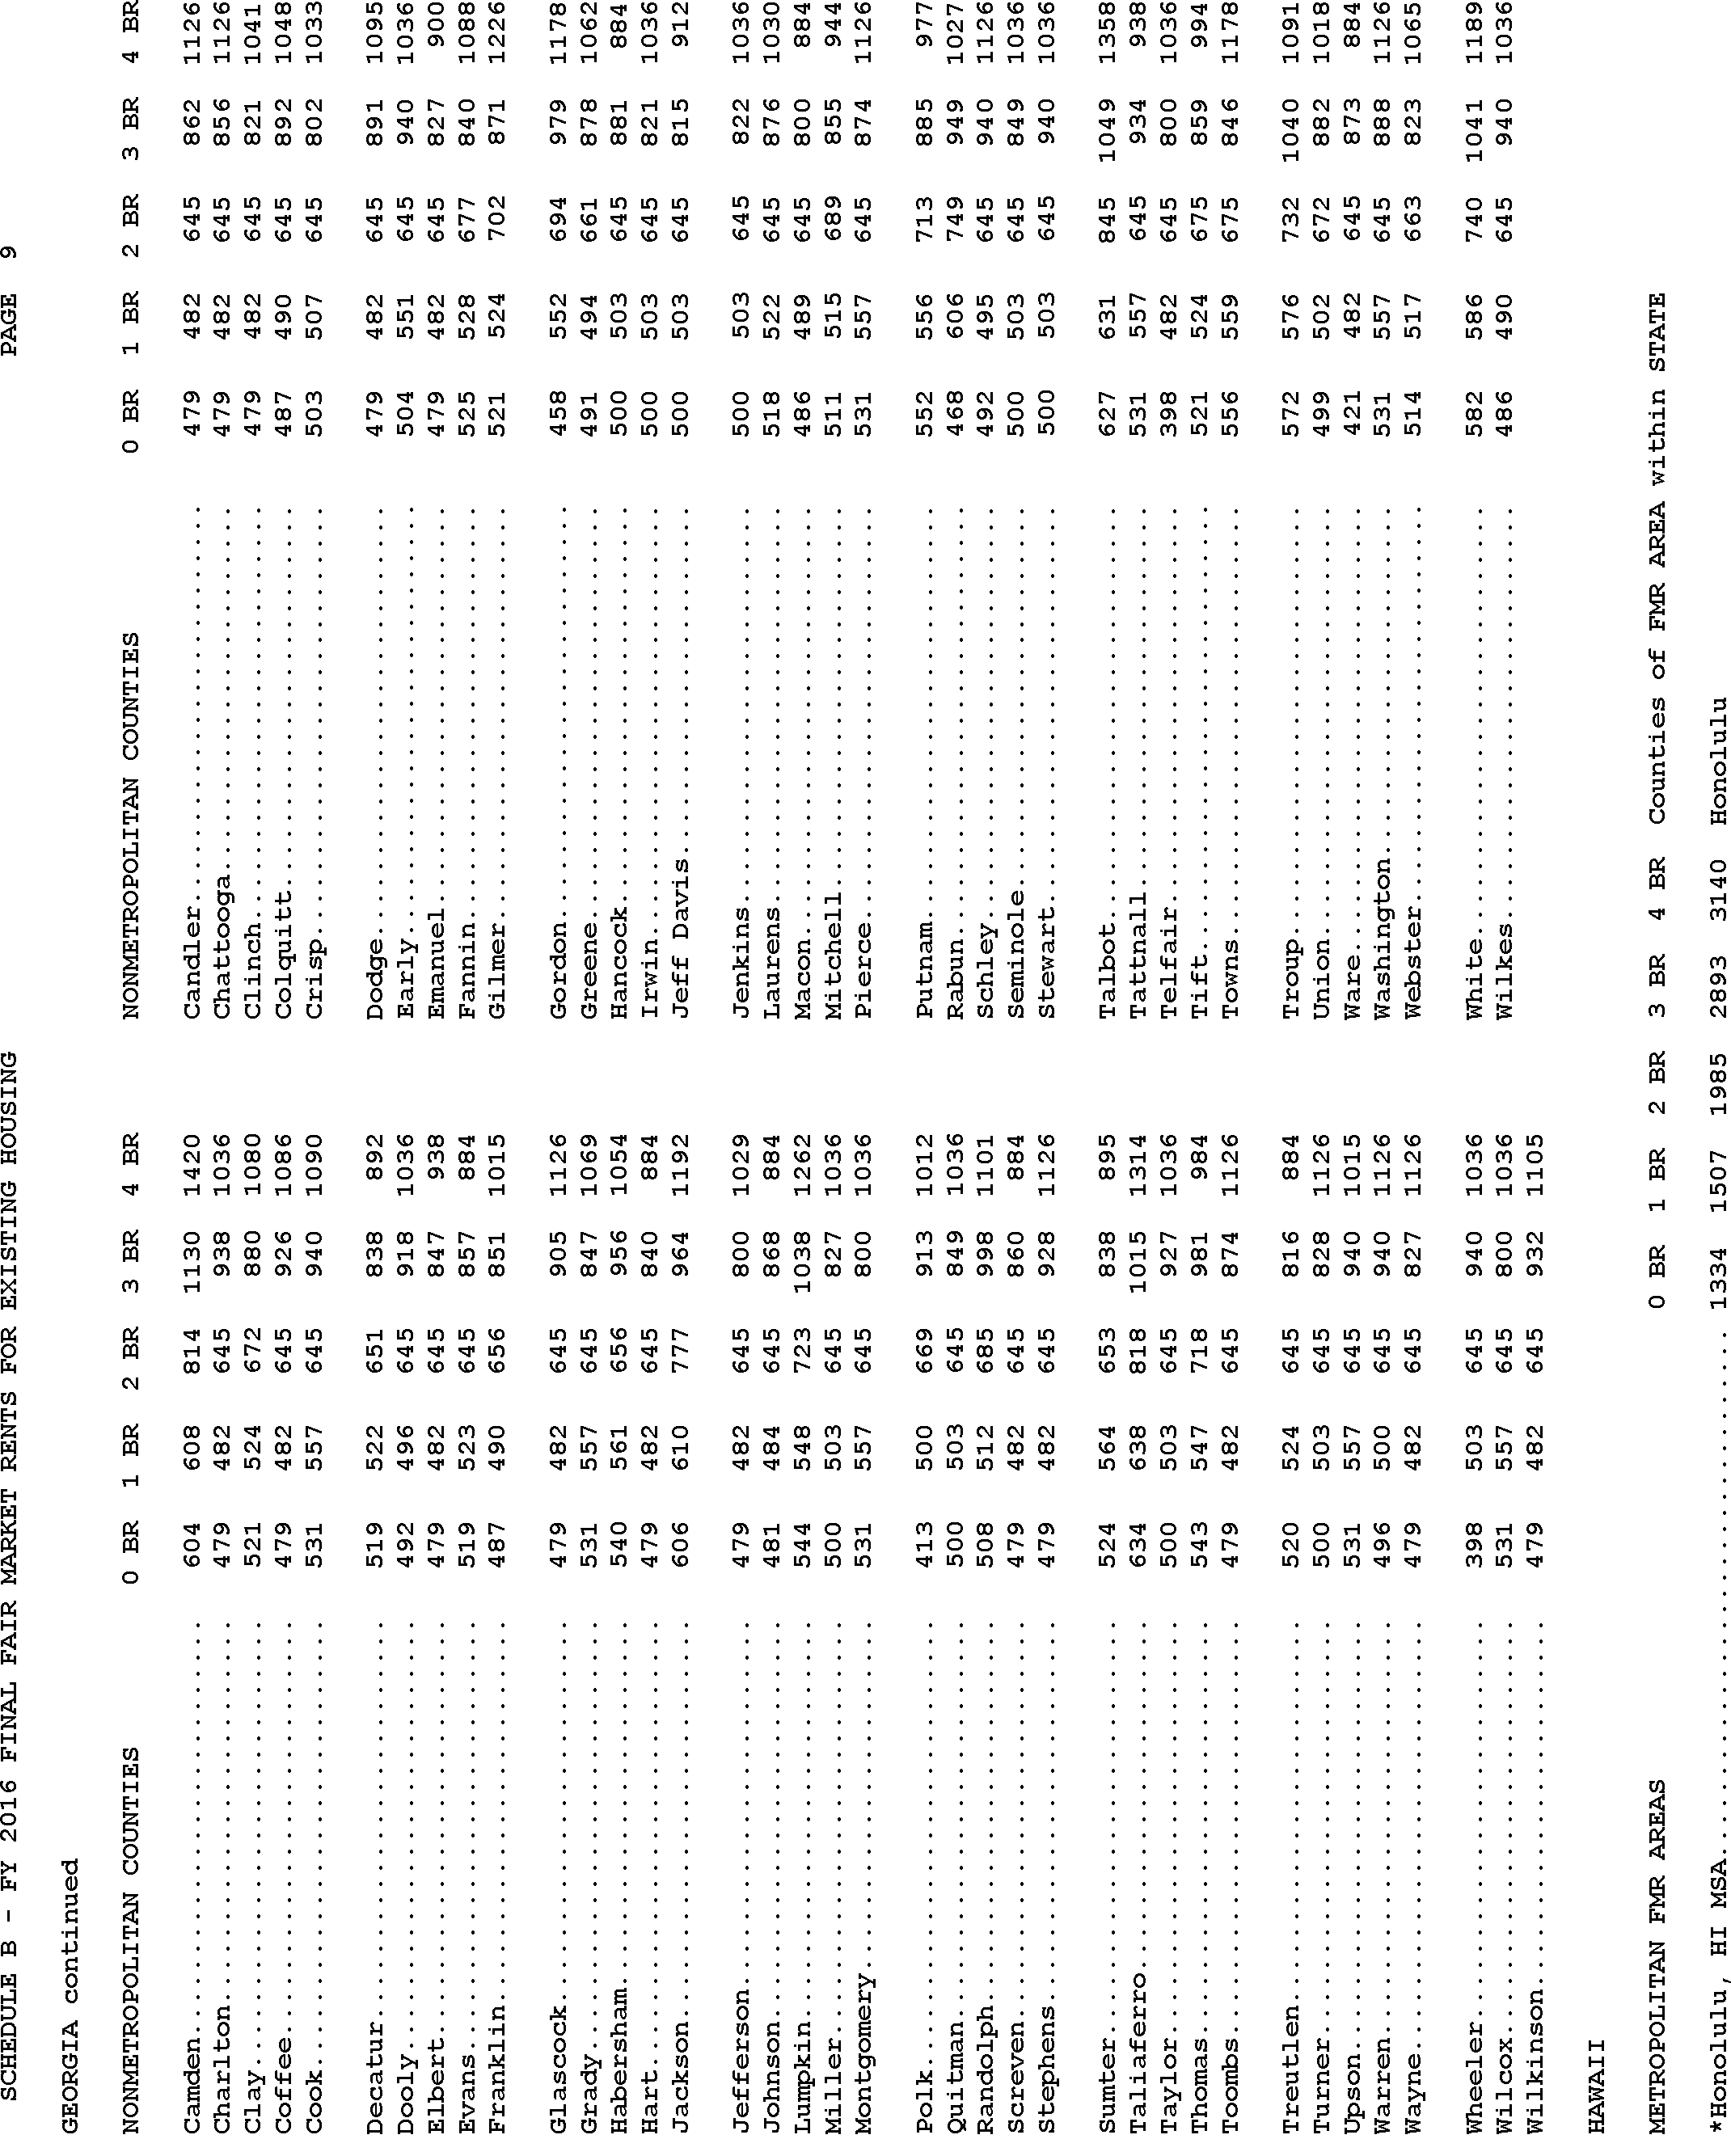
Start Printed Page 77144
Start Printed Page 77145
Start Printed Page 77146
Start Printed Page 77147
Start Printed Page 77148
Start Printed Page 77149
Start Printed Page 77150
Start Printed Page 77151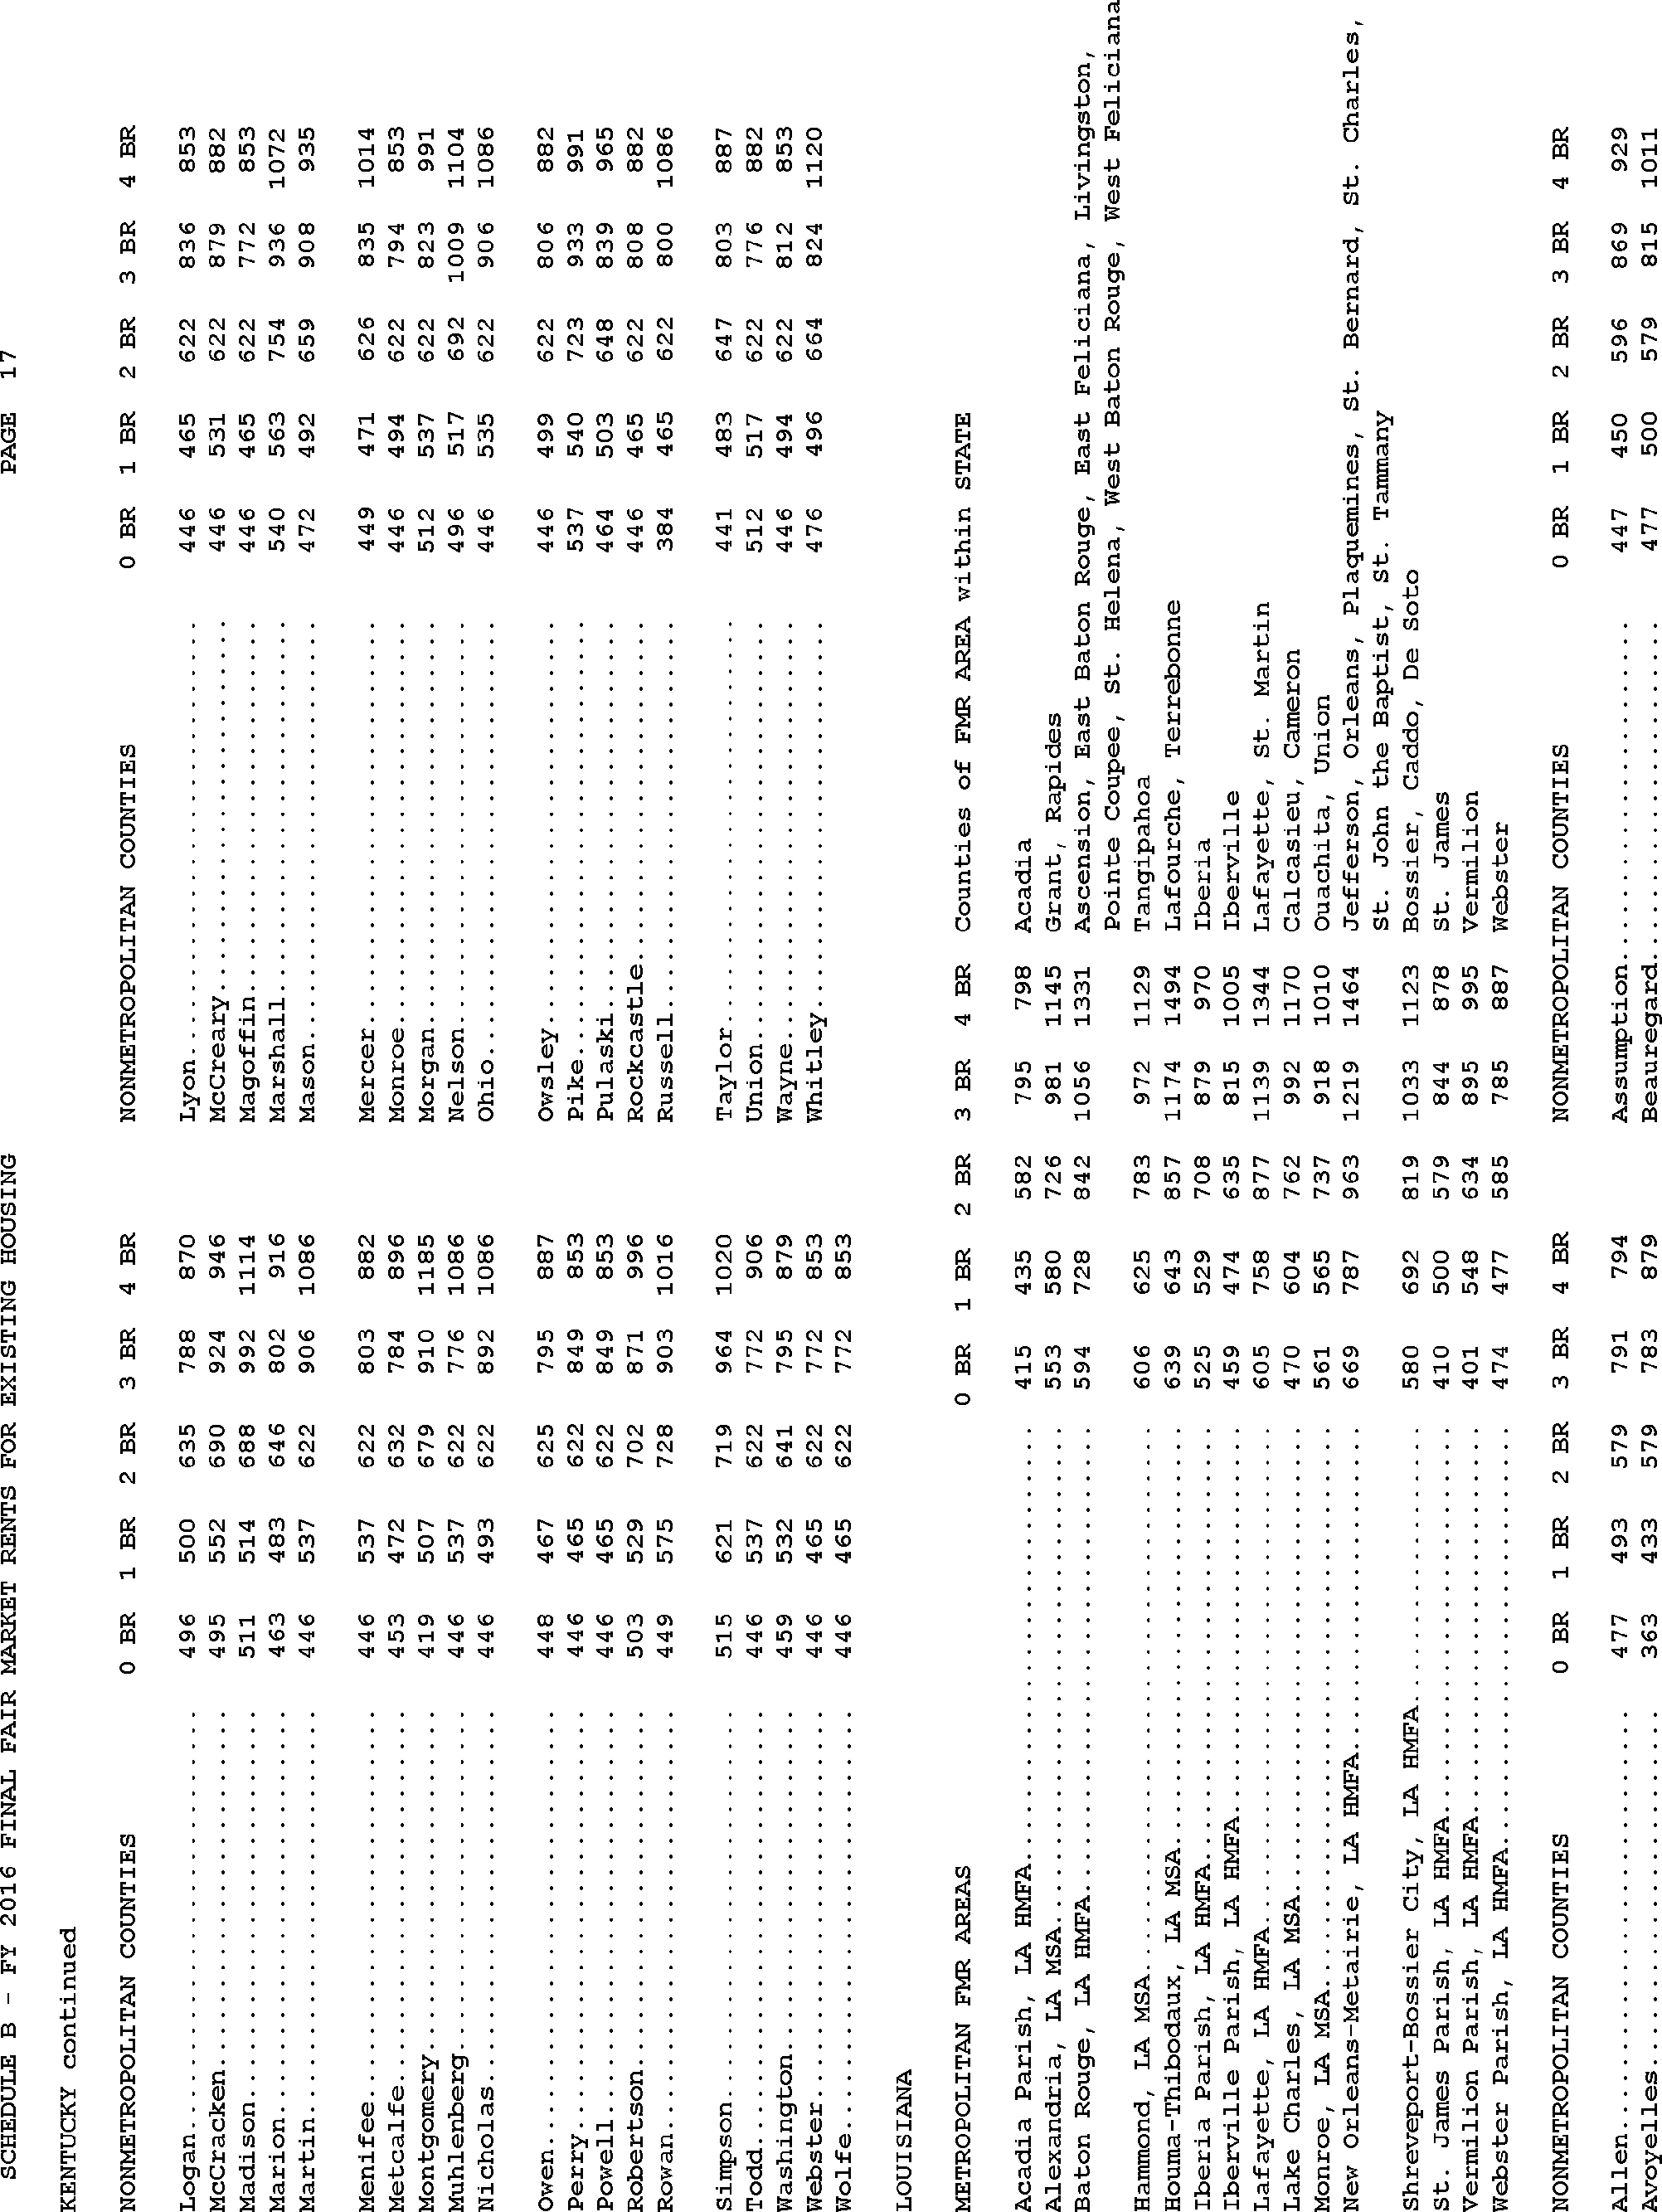
Start Printed Page 77152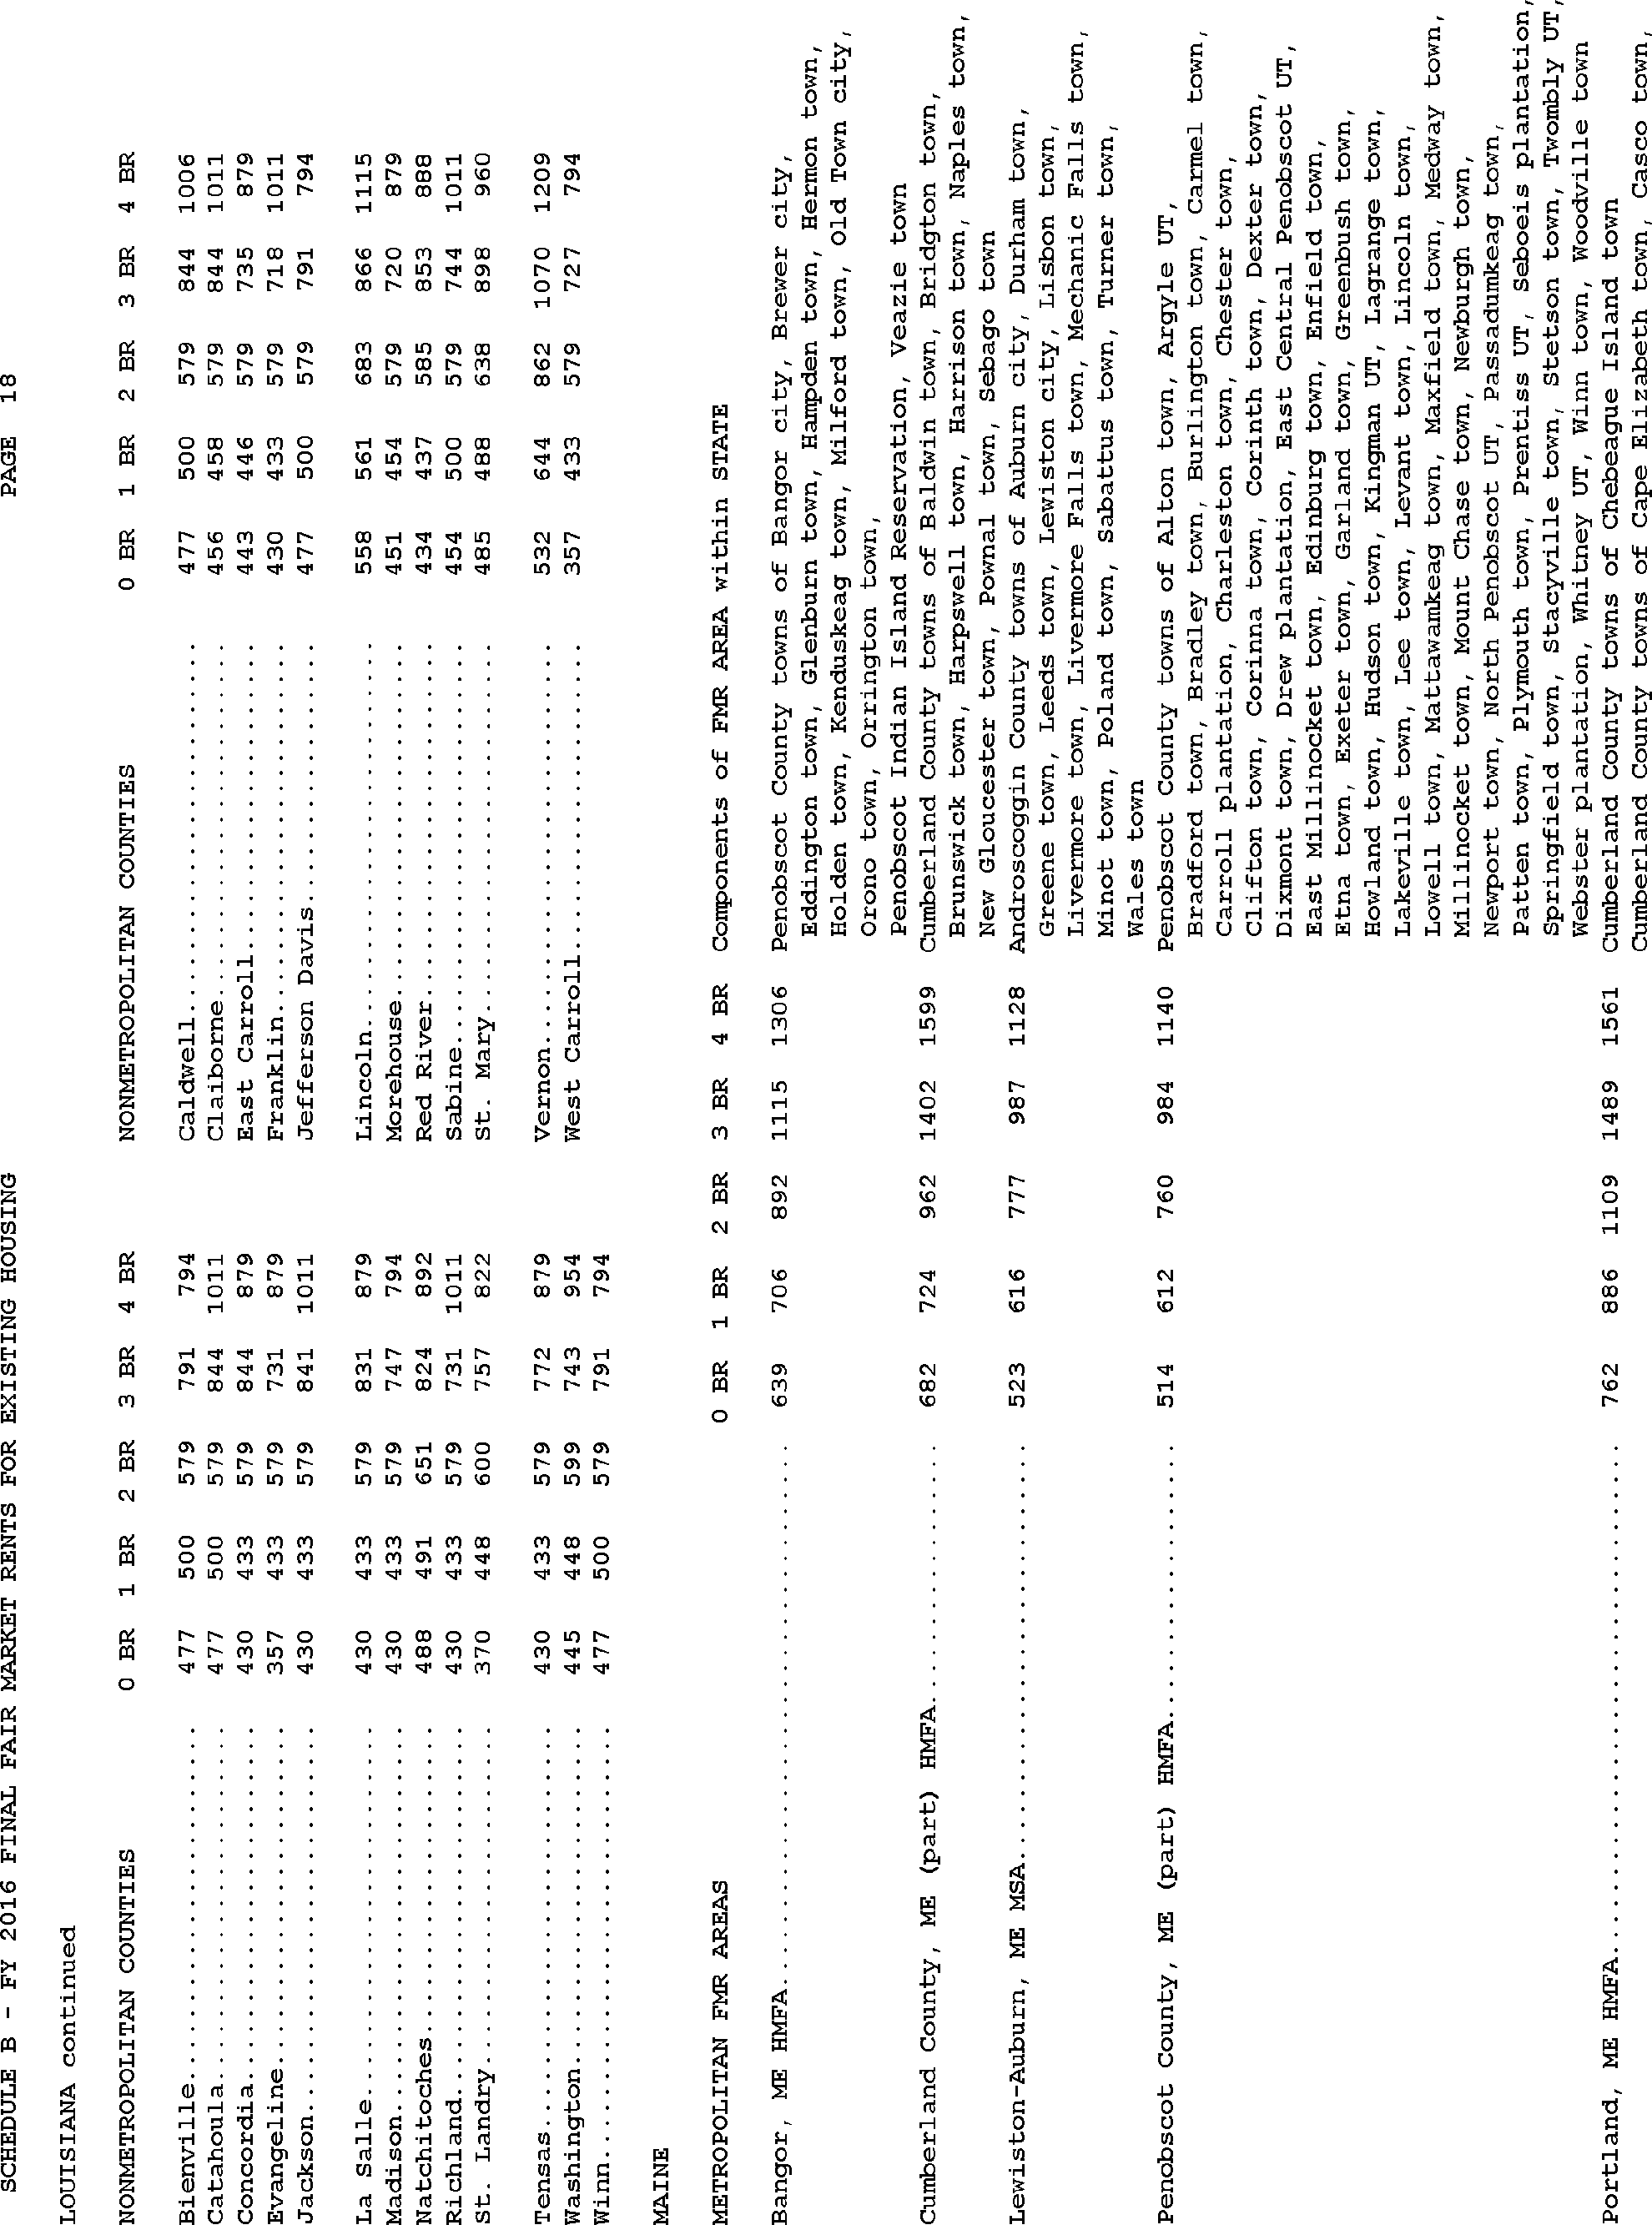
Start Printed Page 77153
Start Printed Page 77154
Start Printed Page 77155
Start Printed Page 77156
Start Printed Page 77157
Start Printed Page 77158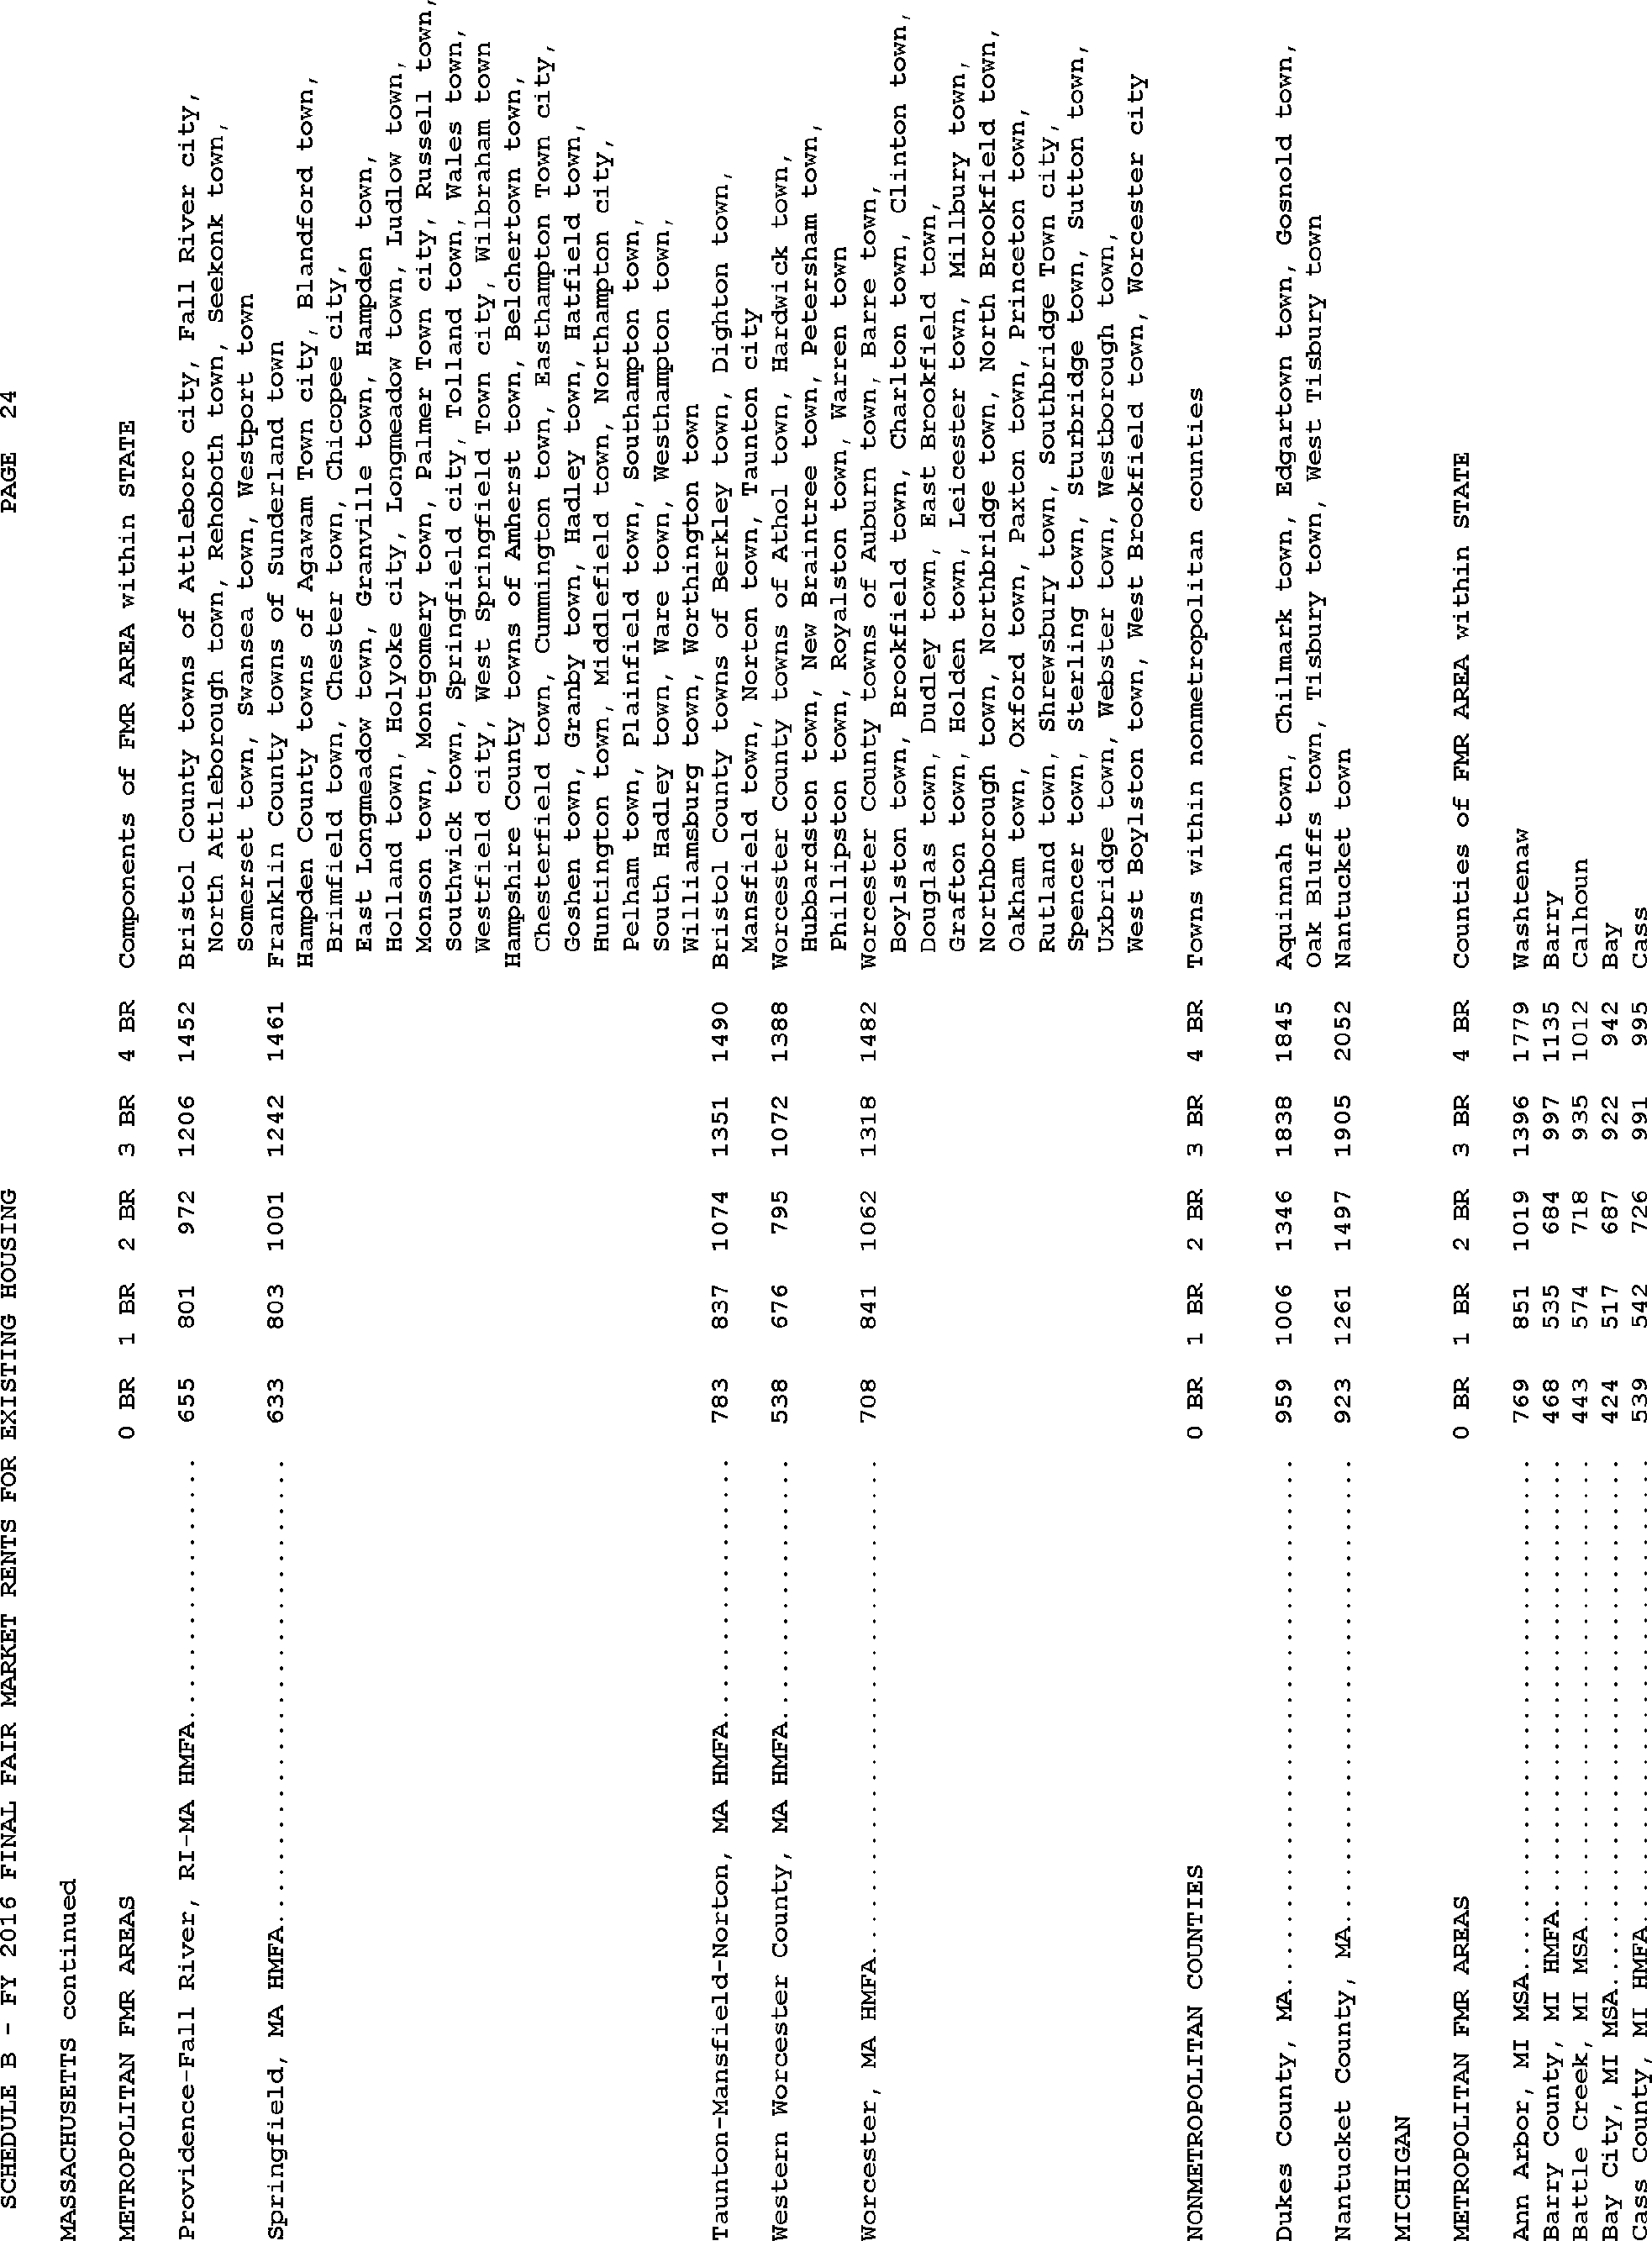
Start Printed Page 77159
Start Printed Page 77160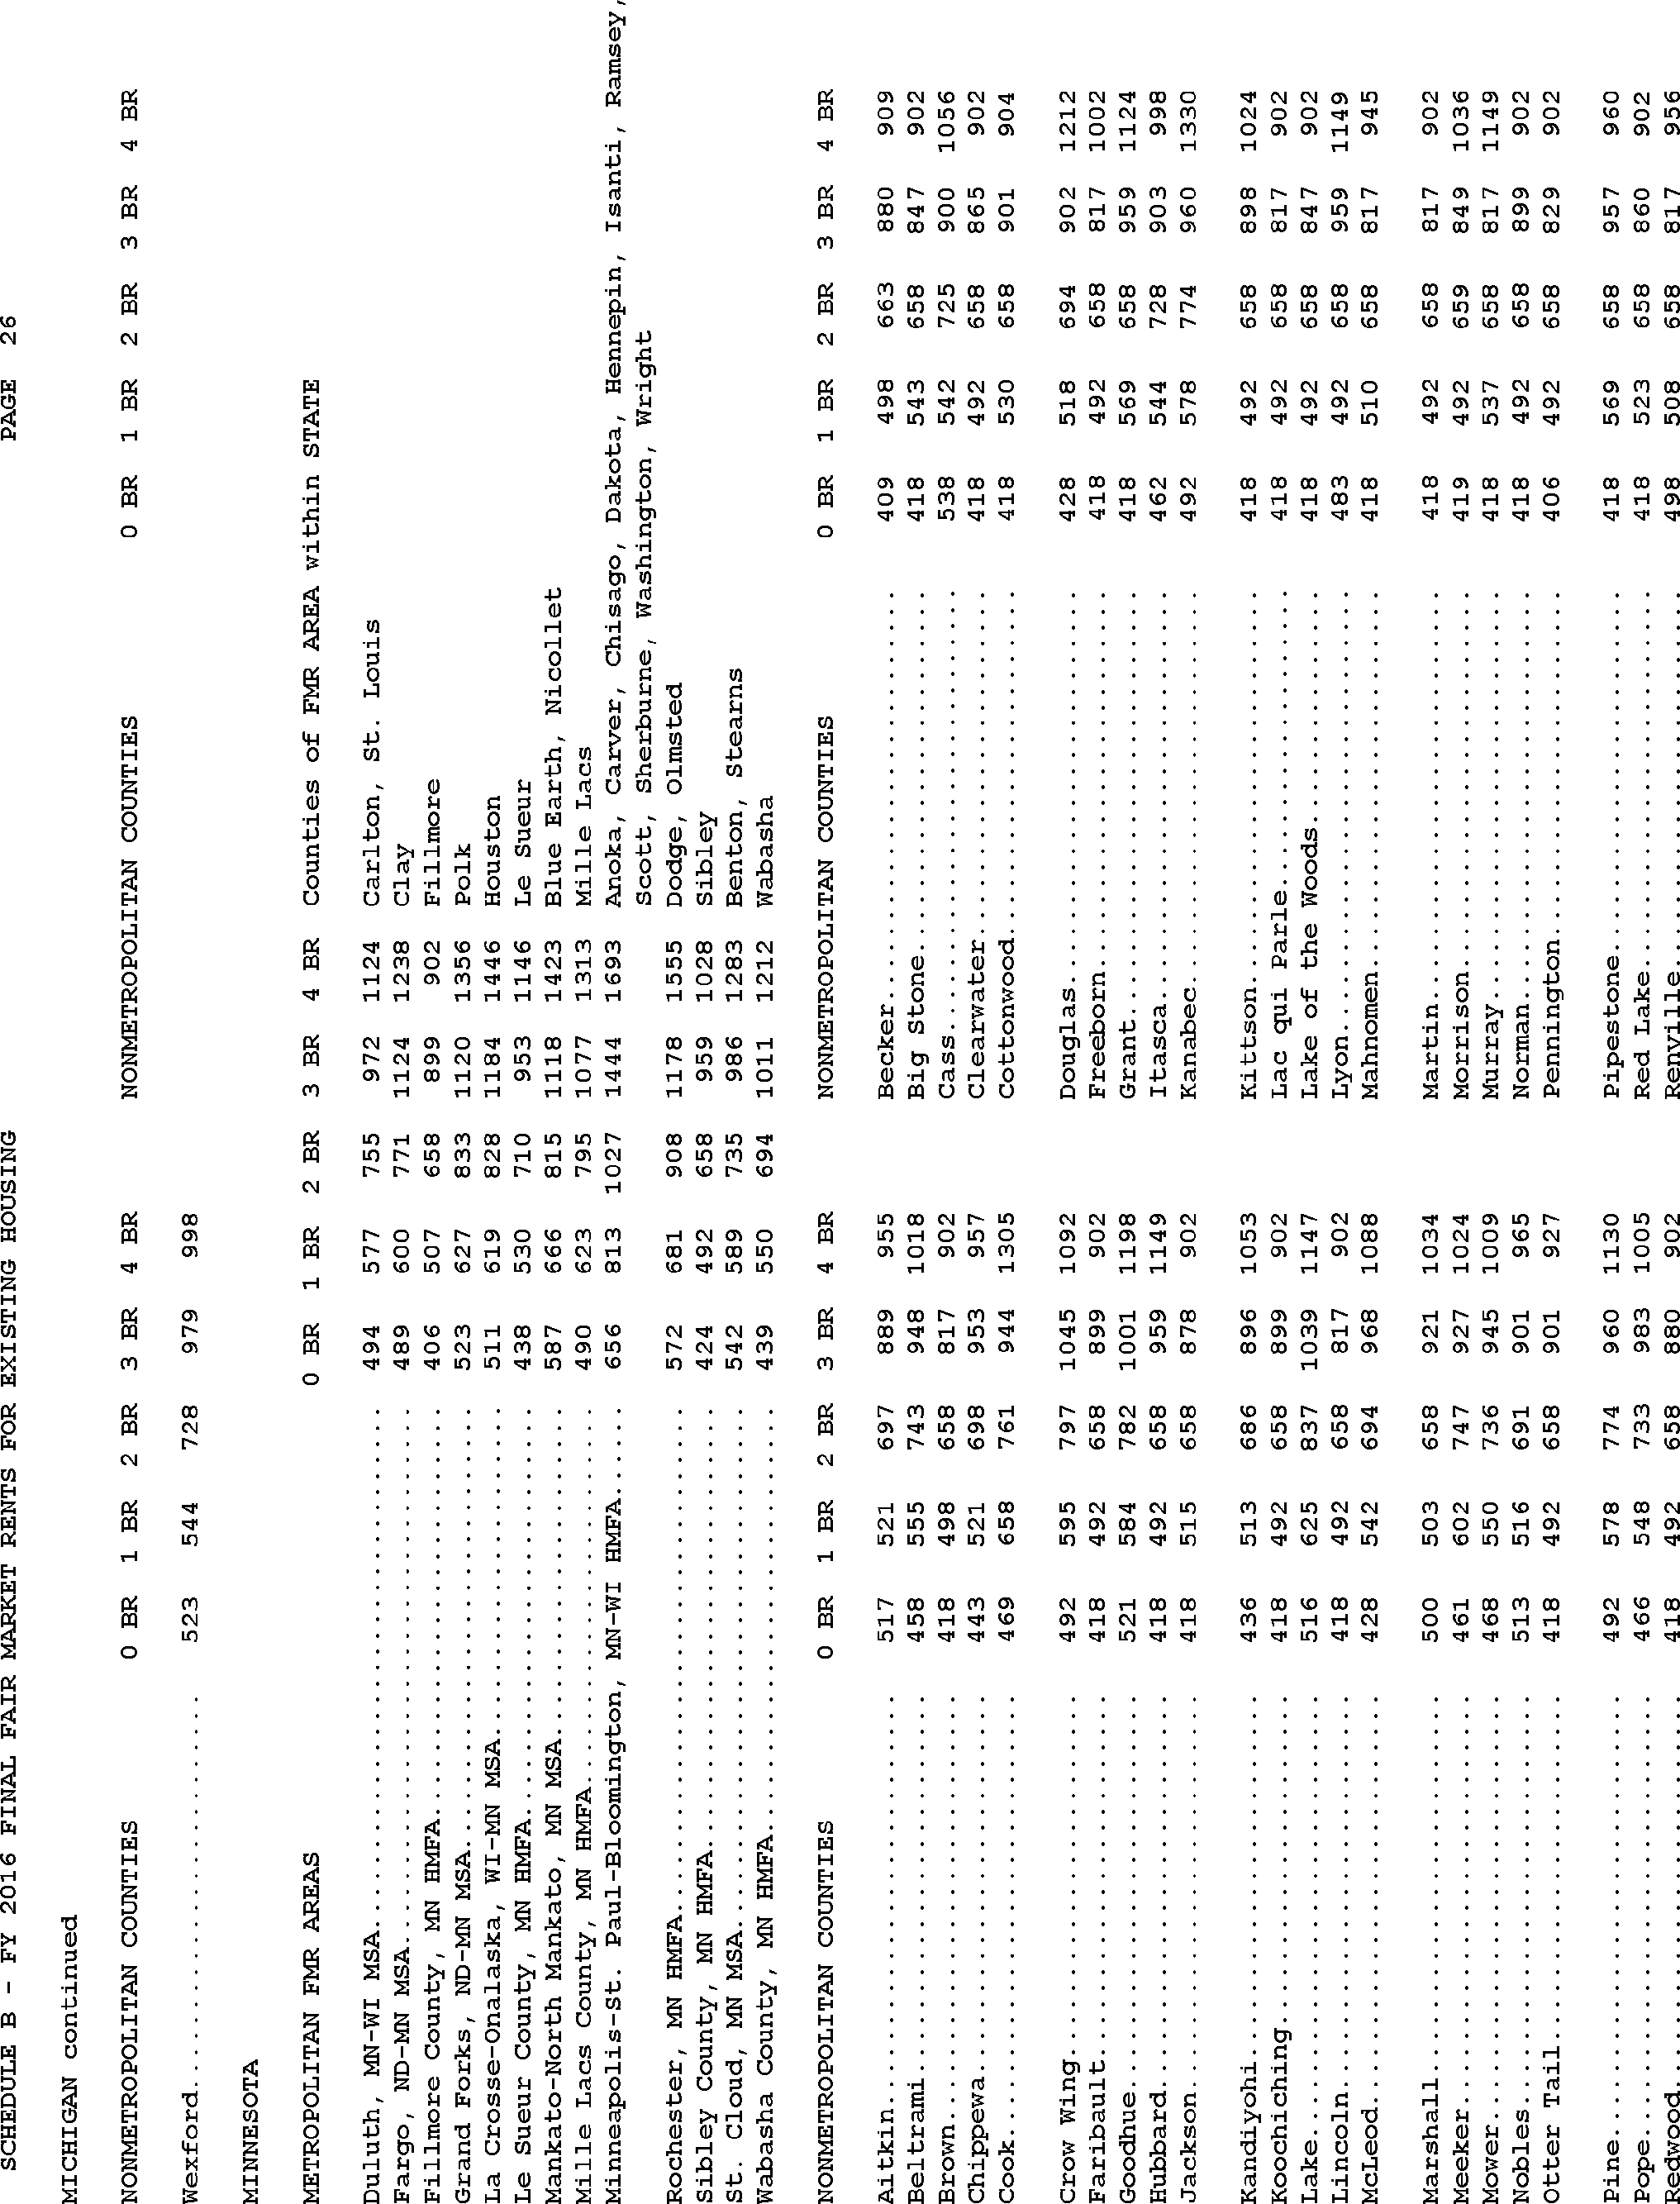
Start Printed Page 77161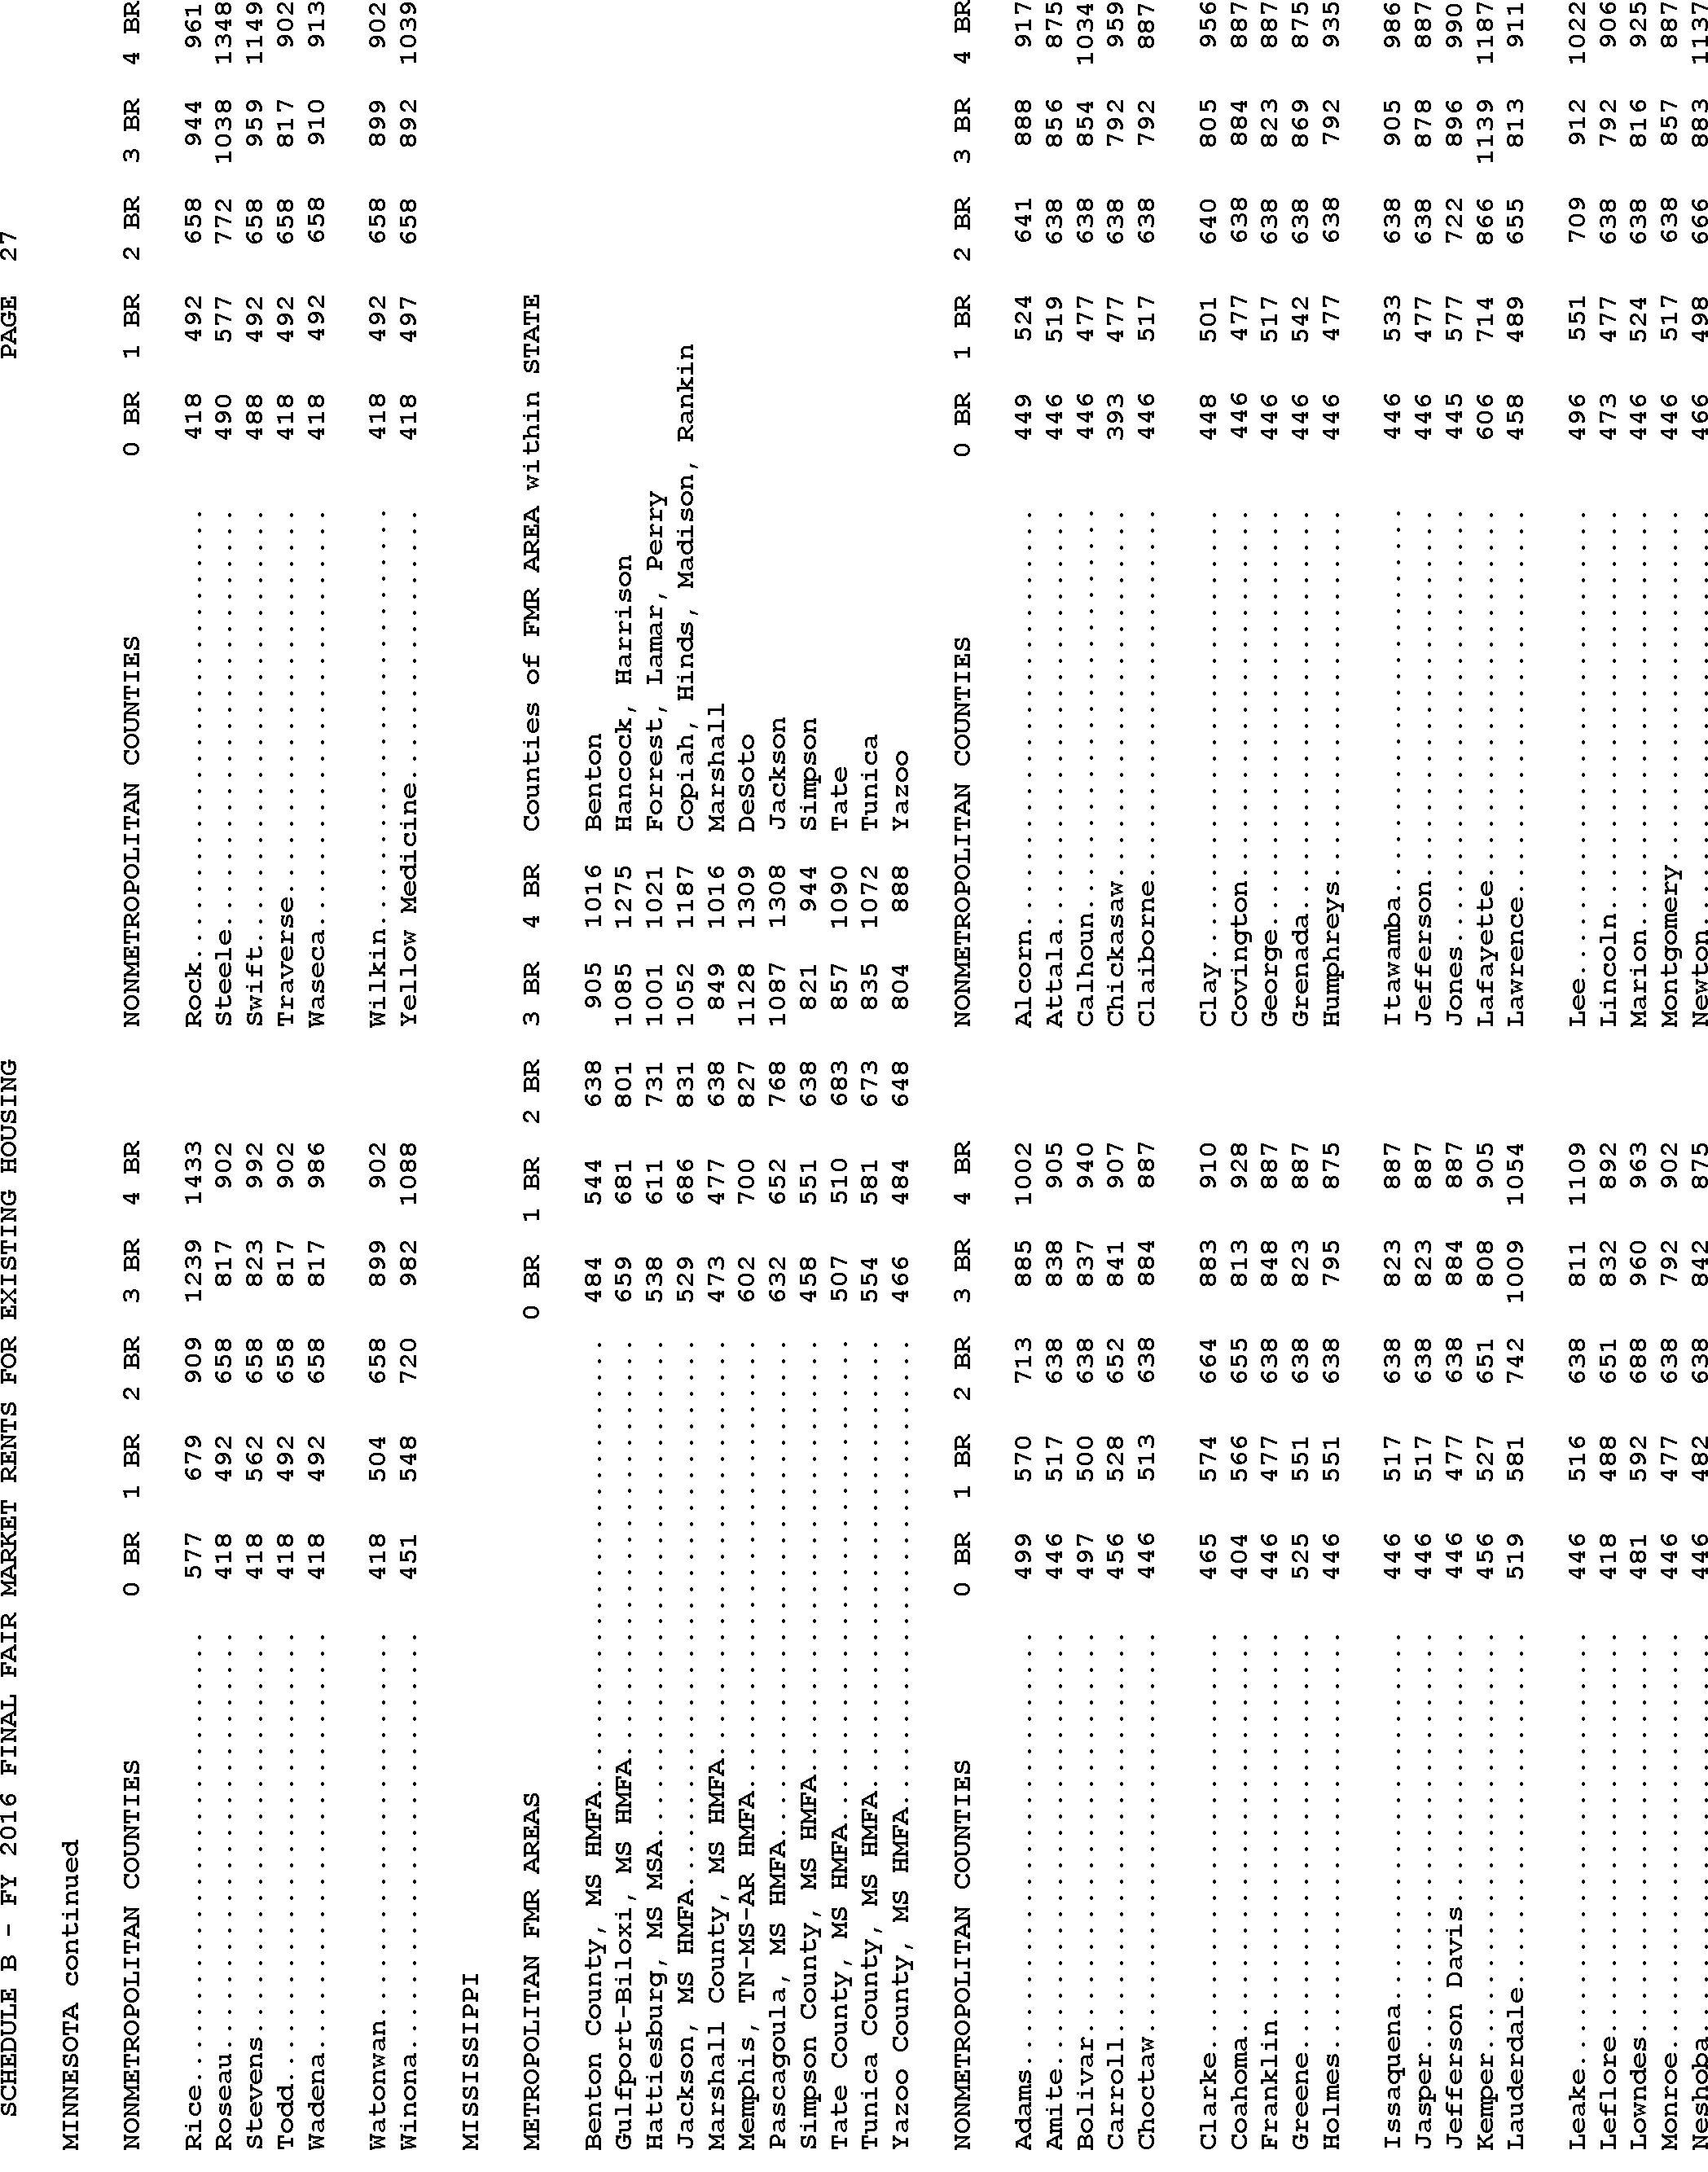
Start Printed Page 77162
Start Printed Page 77163
Start Printed Page 77164
Start Printed Page 77165
Start Printed Page 77166
Start Printed Page 77167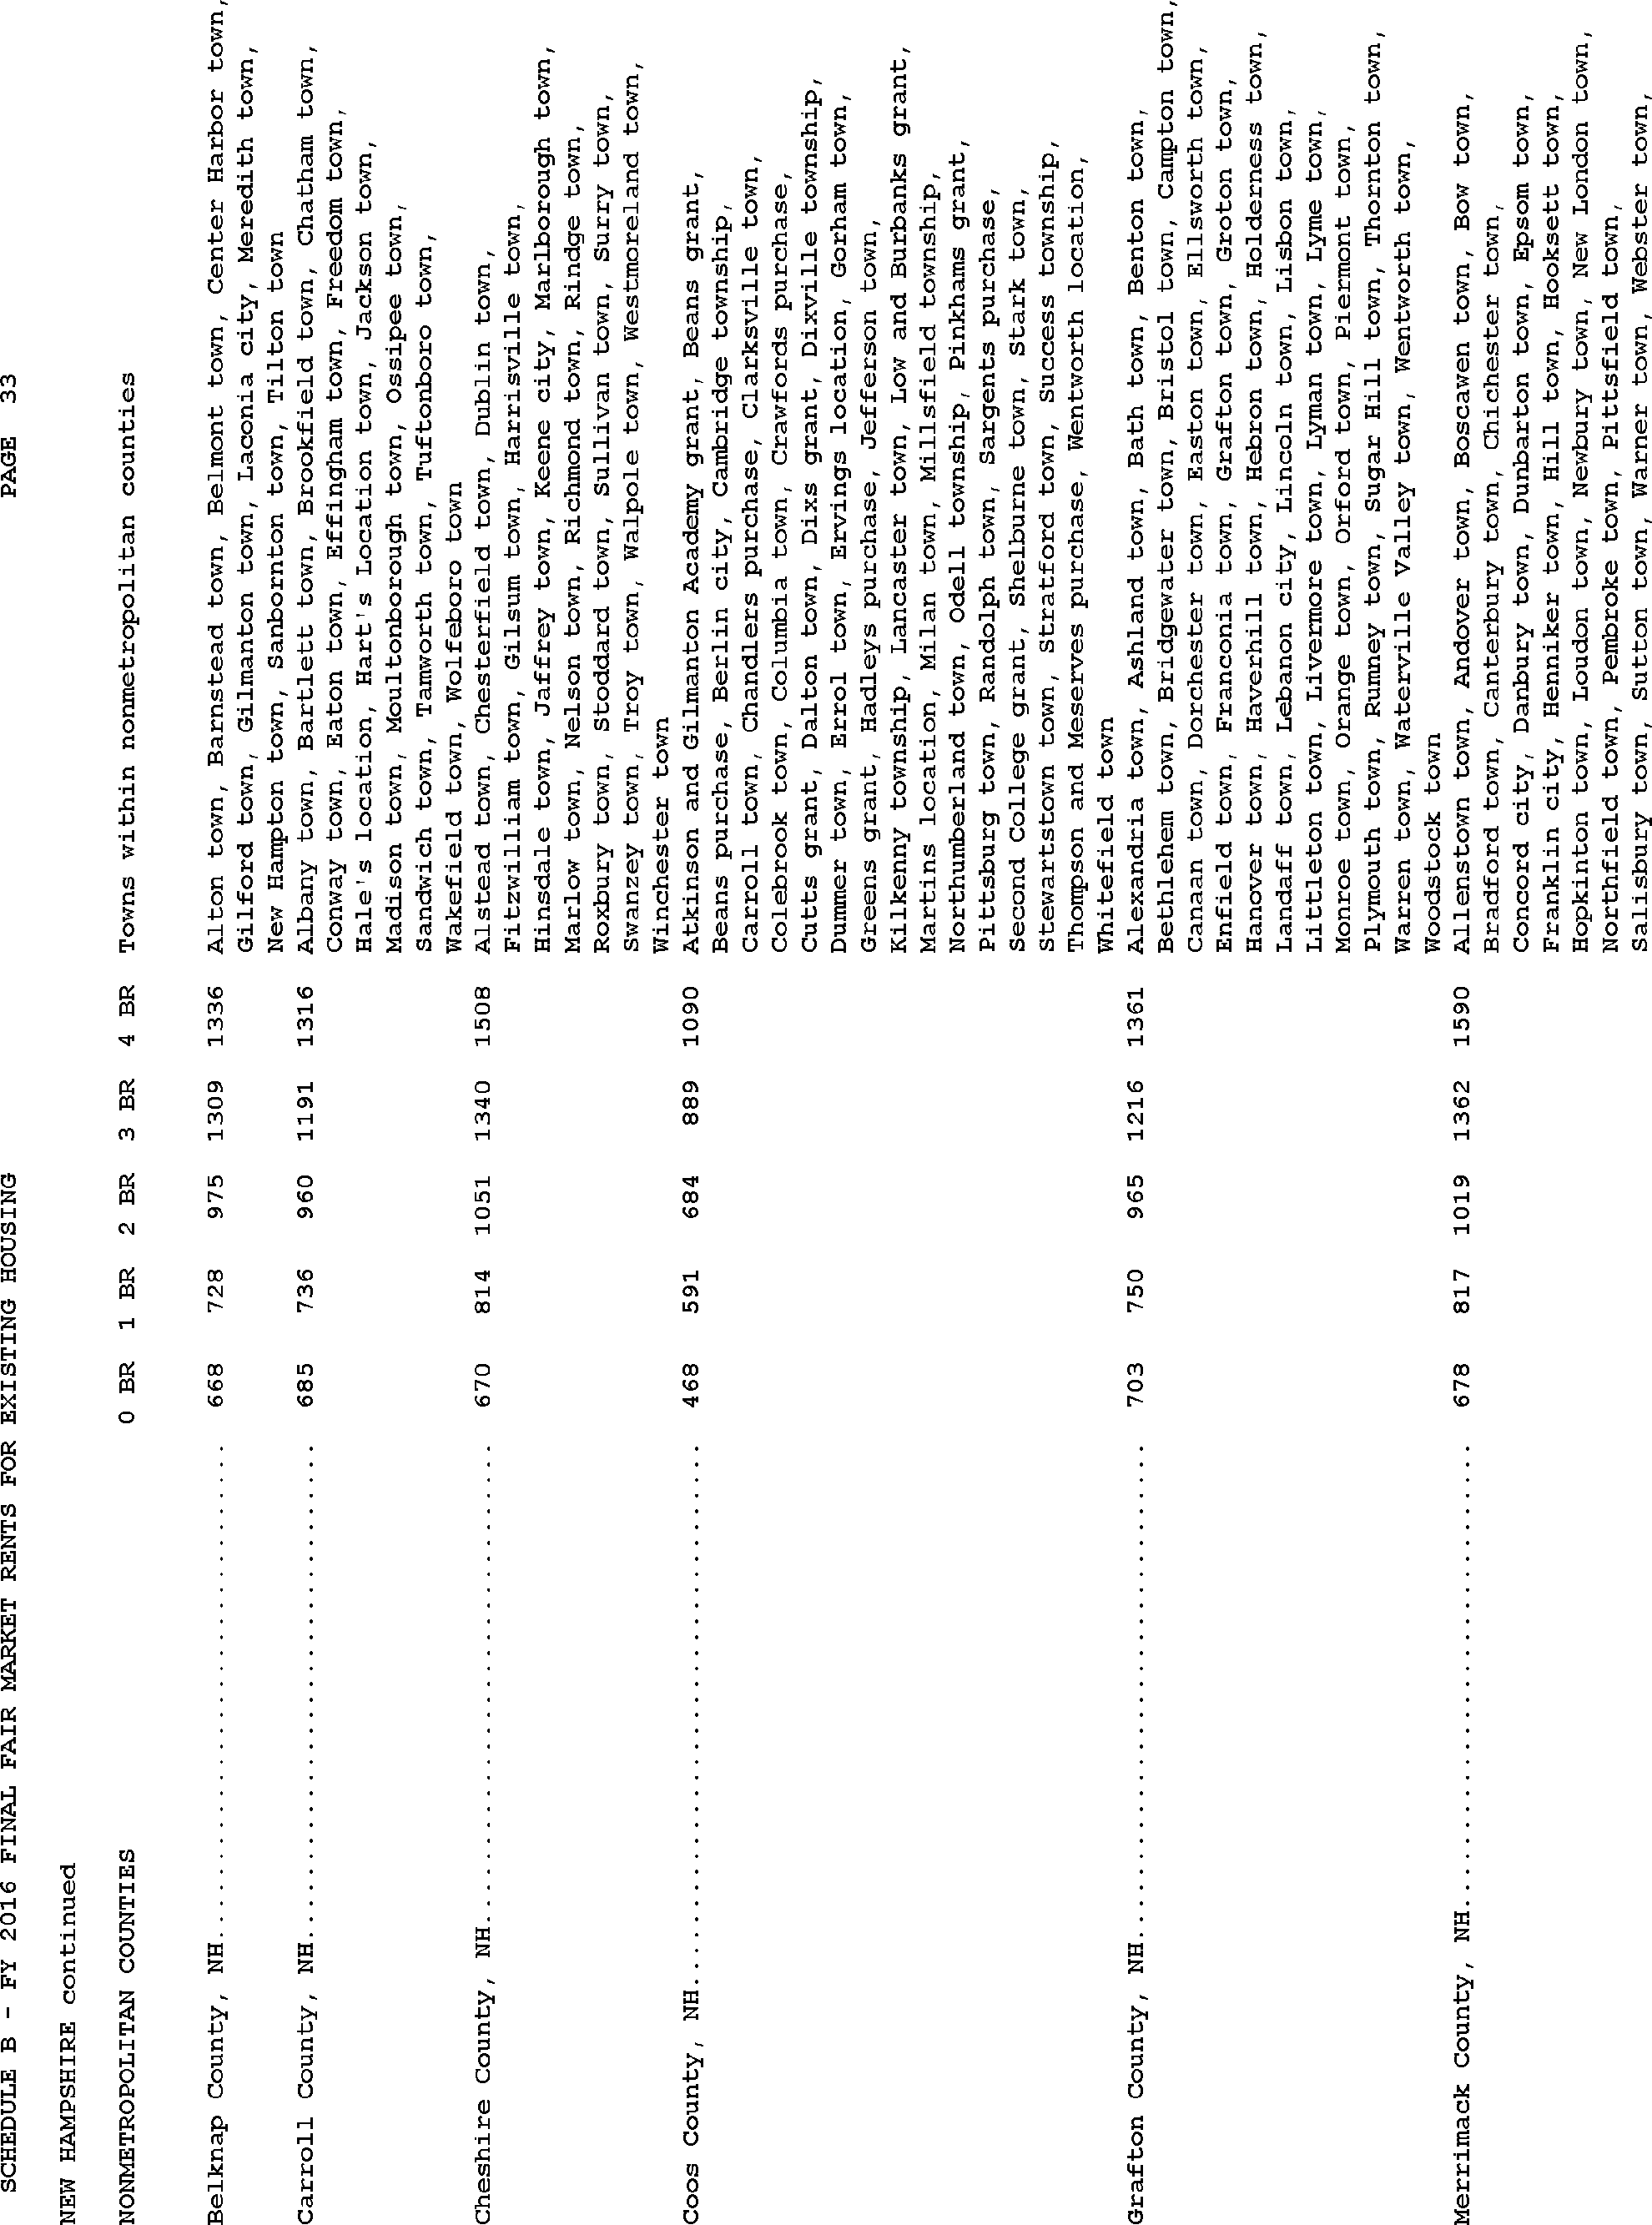
Start Printed Page 77168
Start Printed Page 77169
Start Printed Page 77170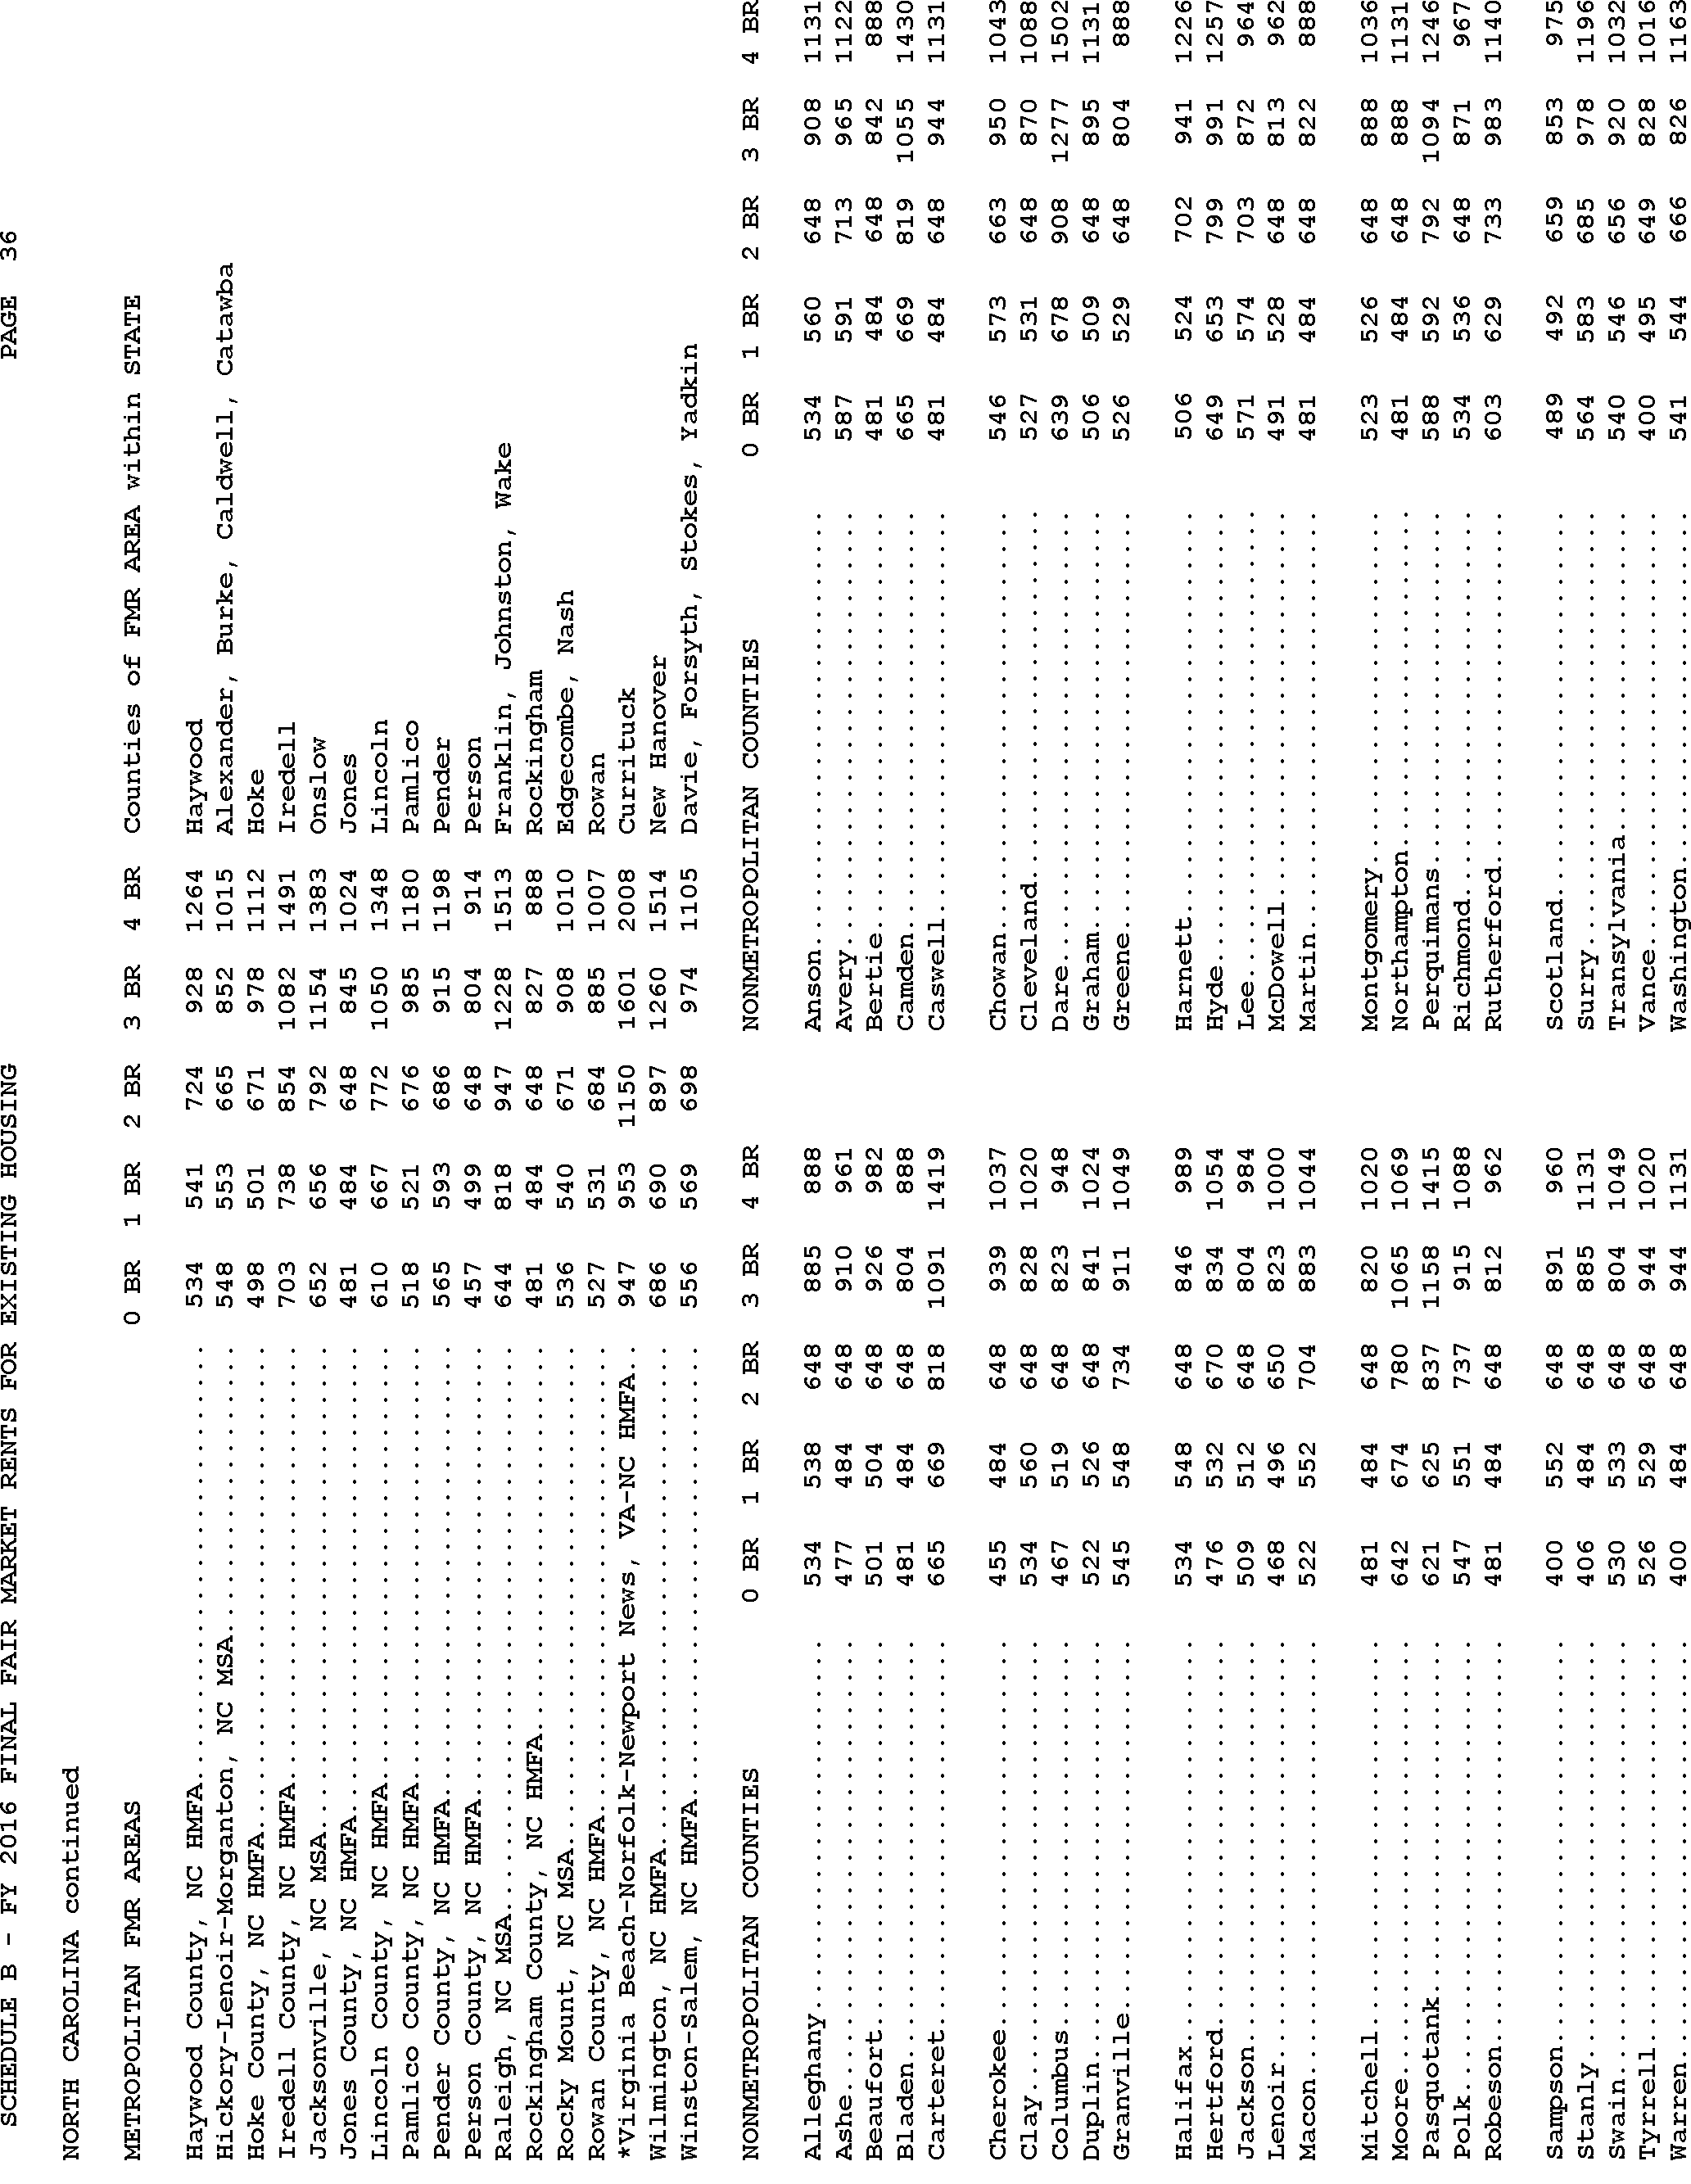
Start Printed Page 77171
Start Printed Page 77172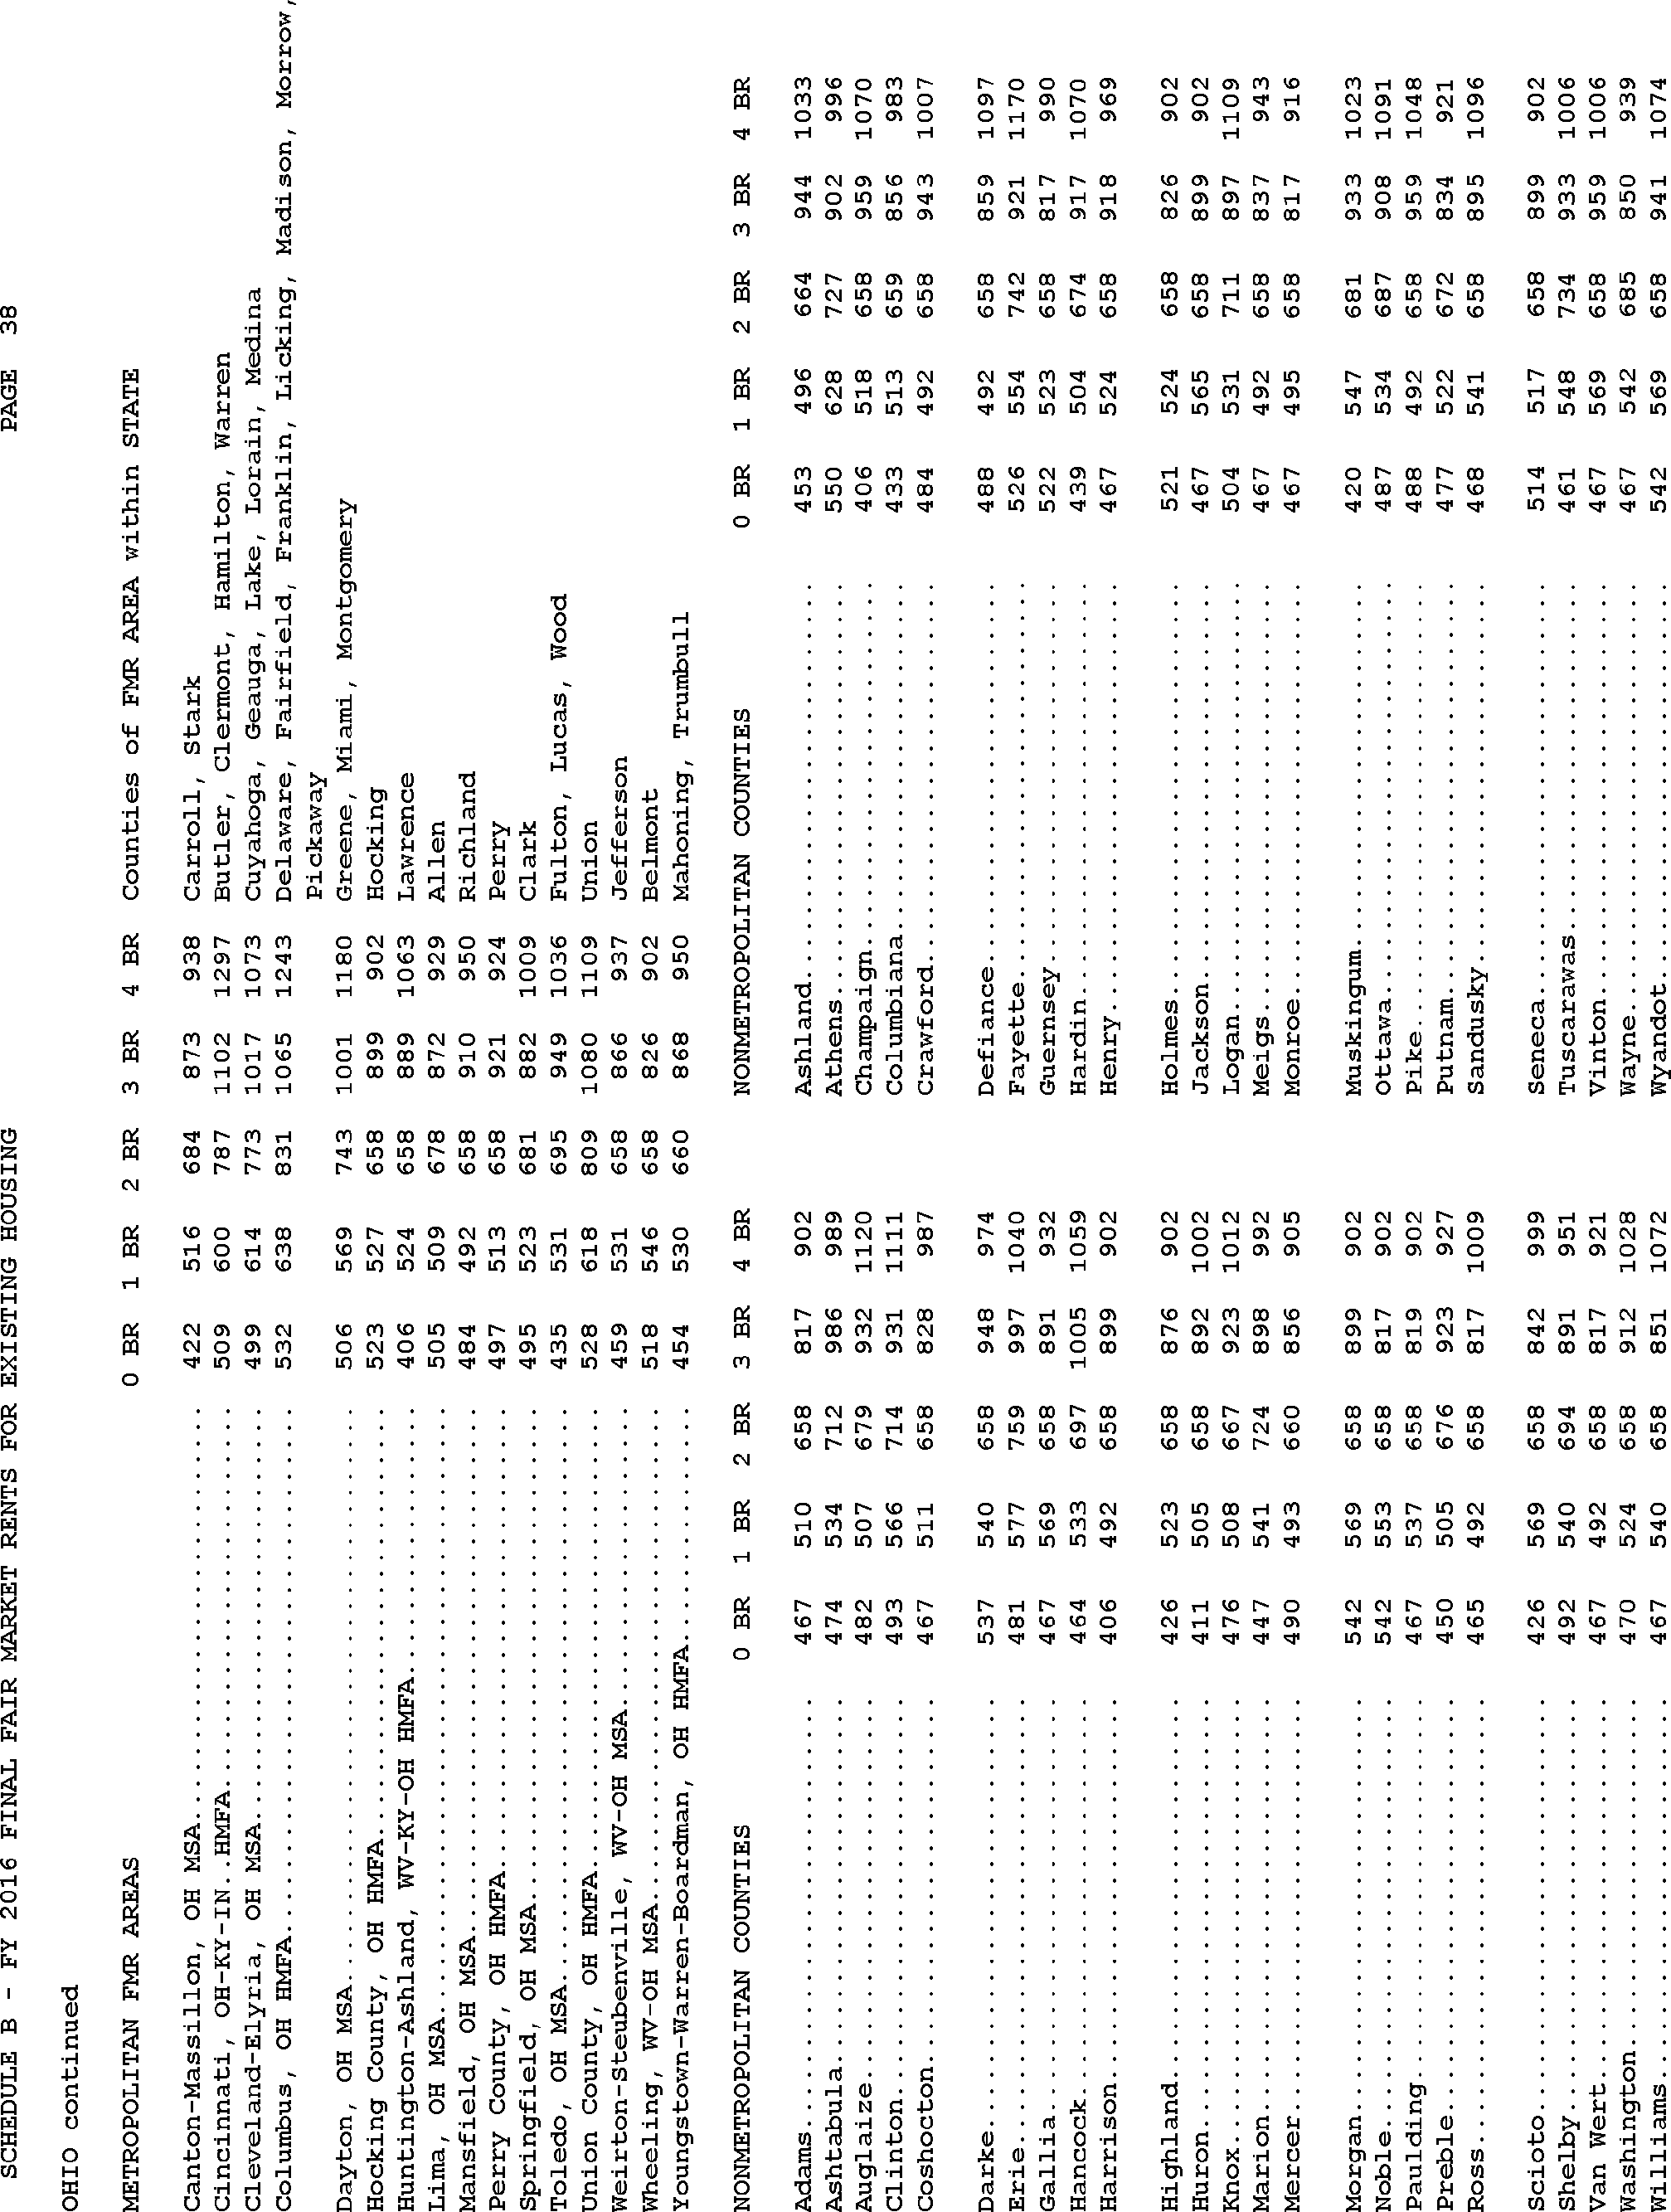
Start Printed Page 77173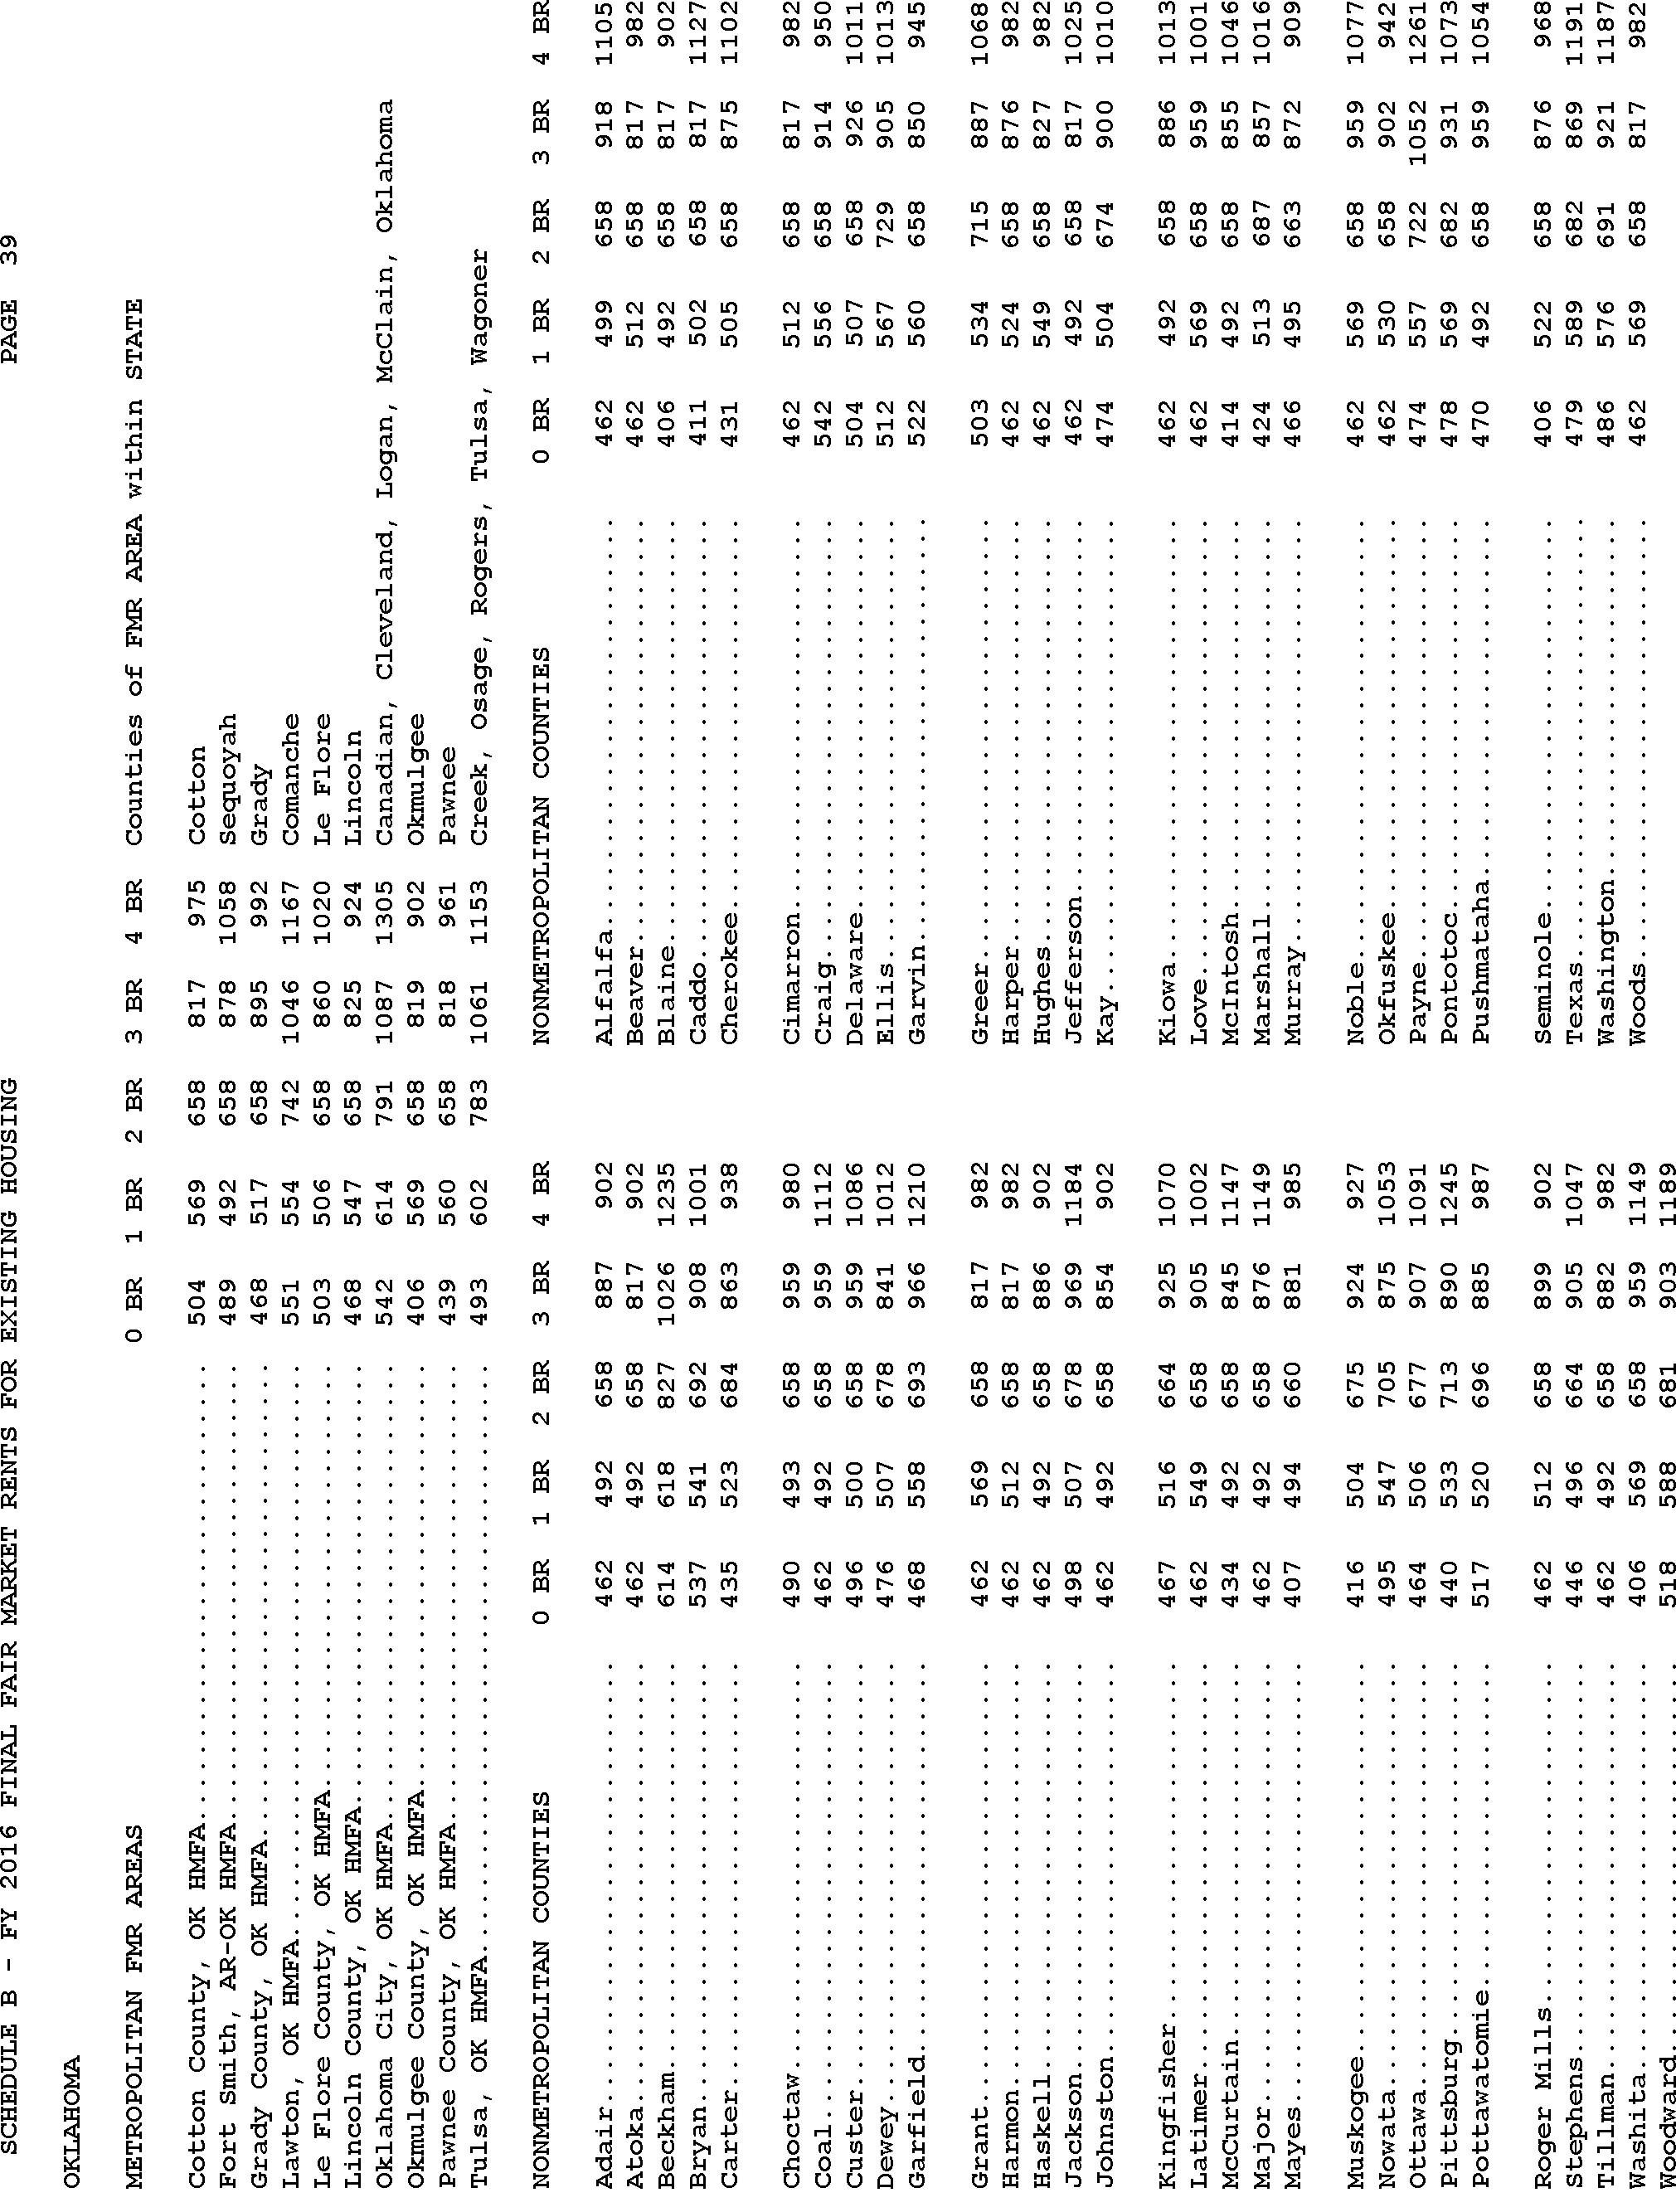
Start Printed Page 77174
Start Printed Page 77175
Start Printed Page 77176
Start Printed Page 77177
Start Printed Page 77178
Start Printed Page 77180
Start Printed Page 77179
Start Printed Page 77181
Start Printed Page 77182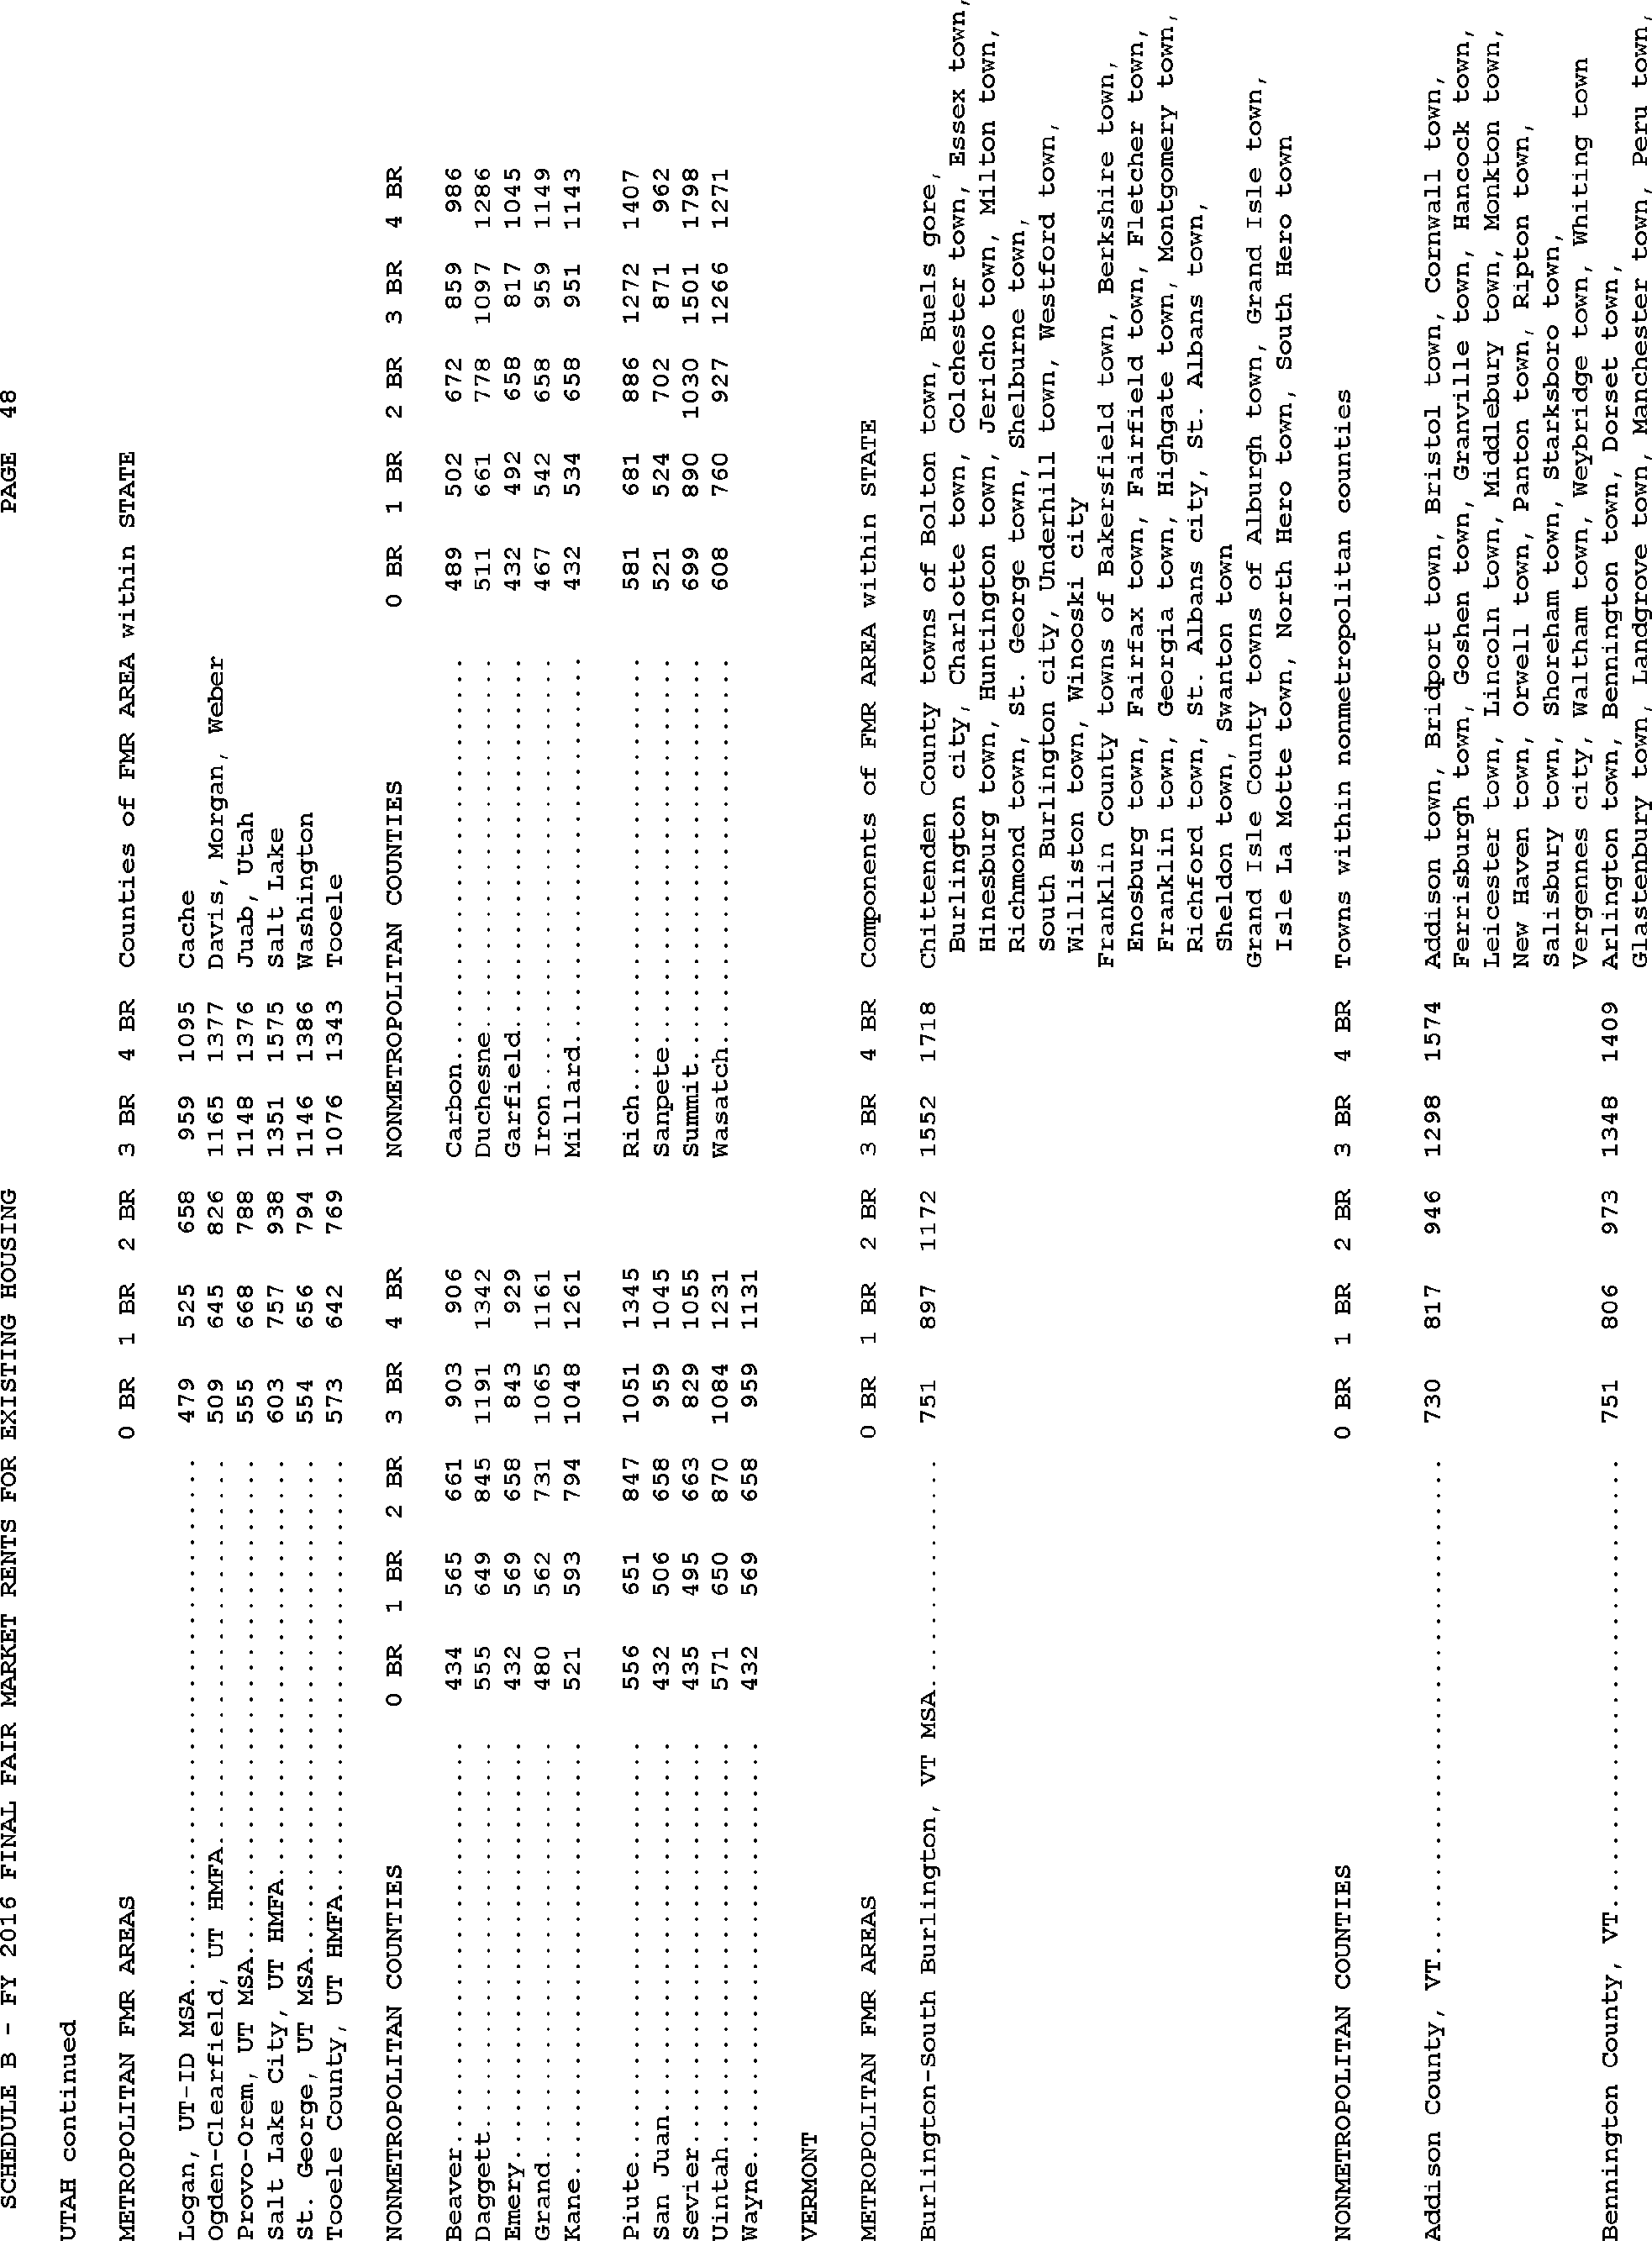
Start Printed Page 77183
Start Printed Page 77184
Start Printed Page 77185
Start Printed Page 77186
Start Printed Page 77187
Start Printed Page 77188
Start Printed Page 77189
Start Printed Page 77190
Start Printed Page 77191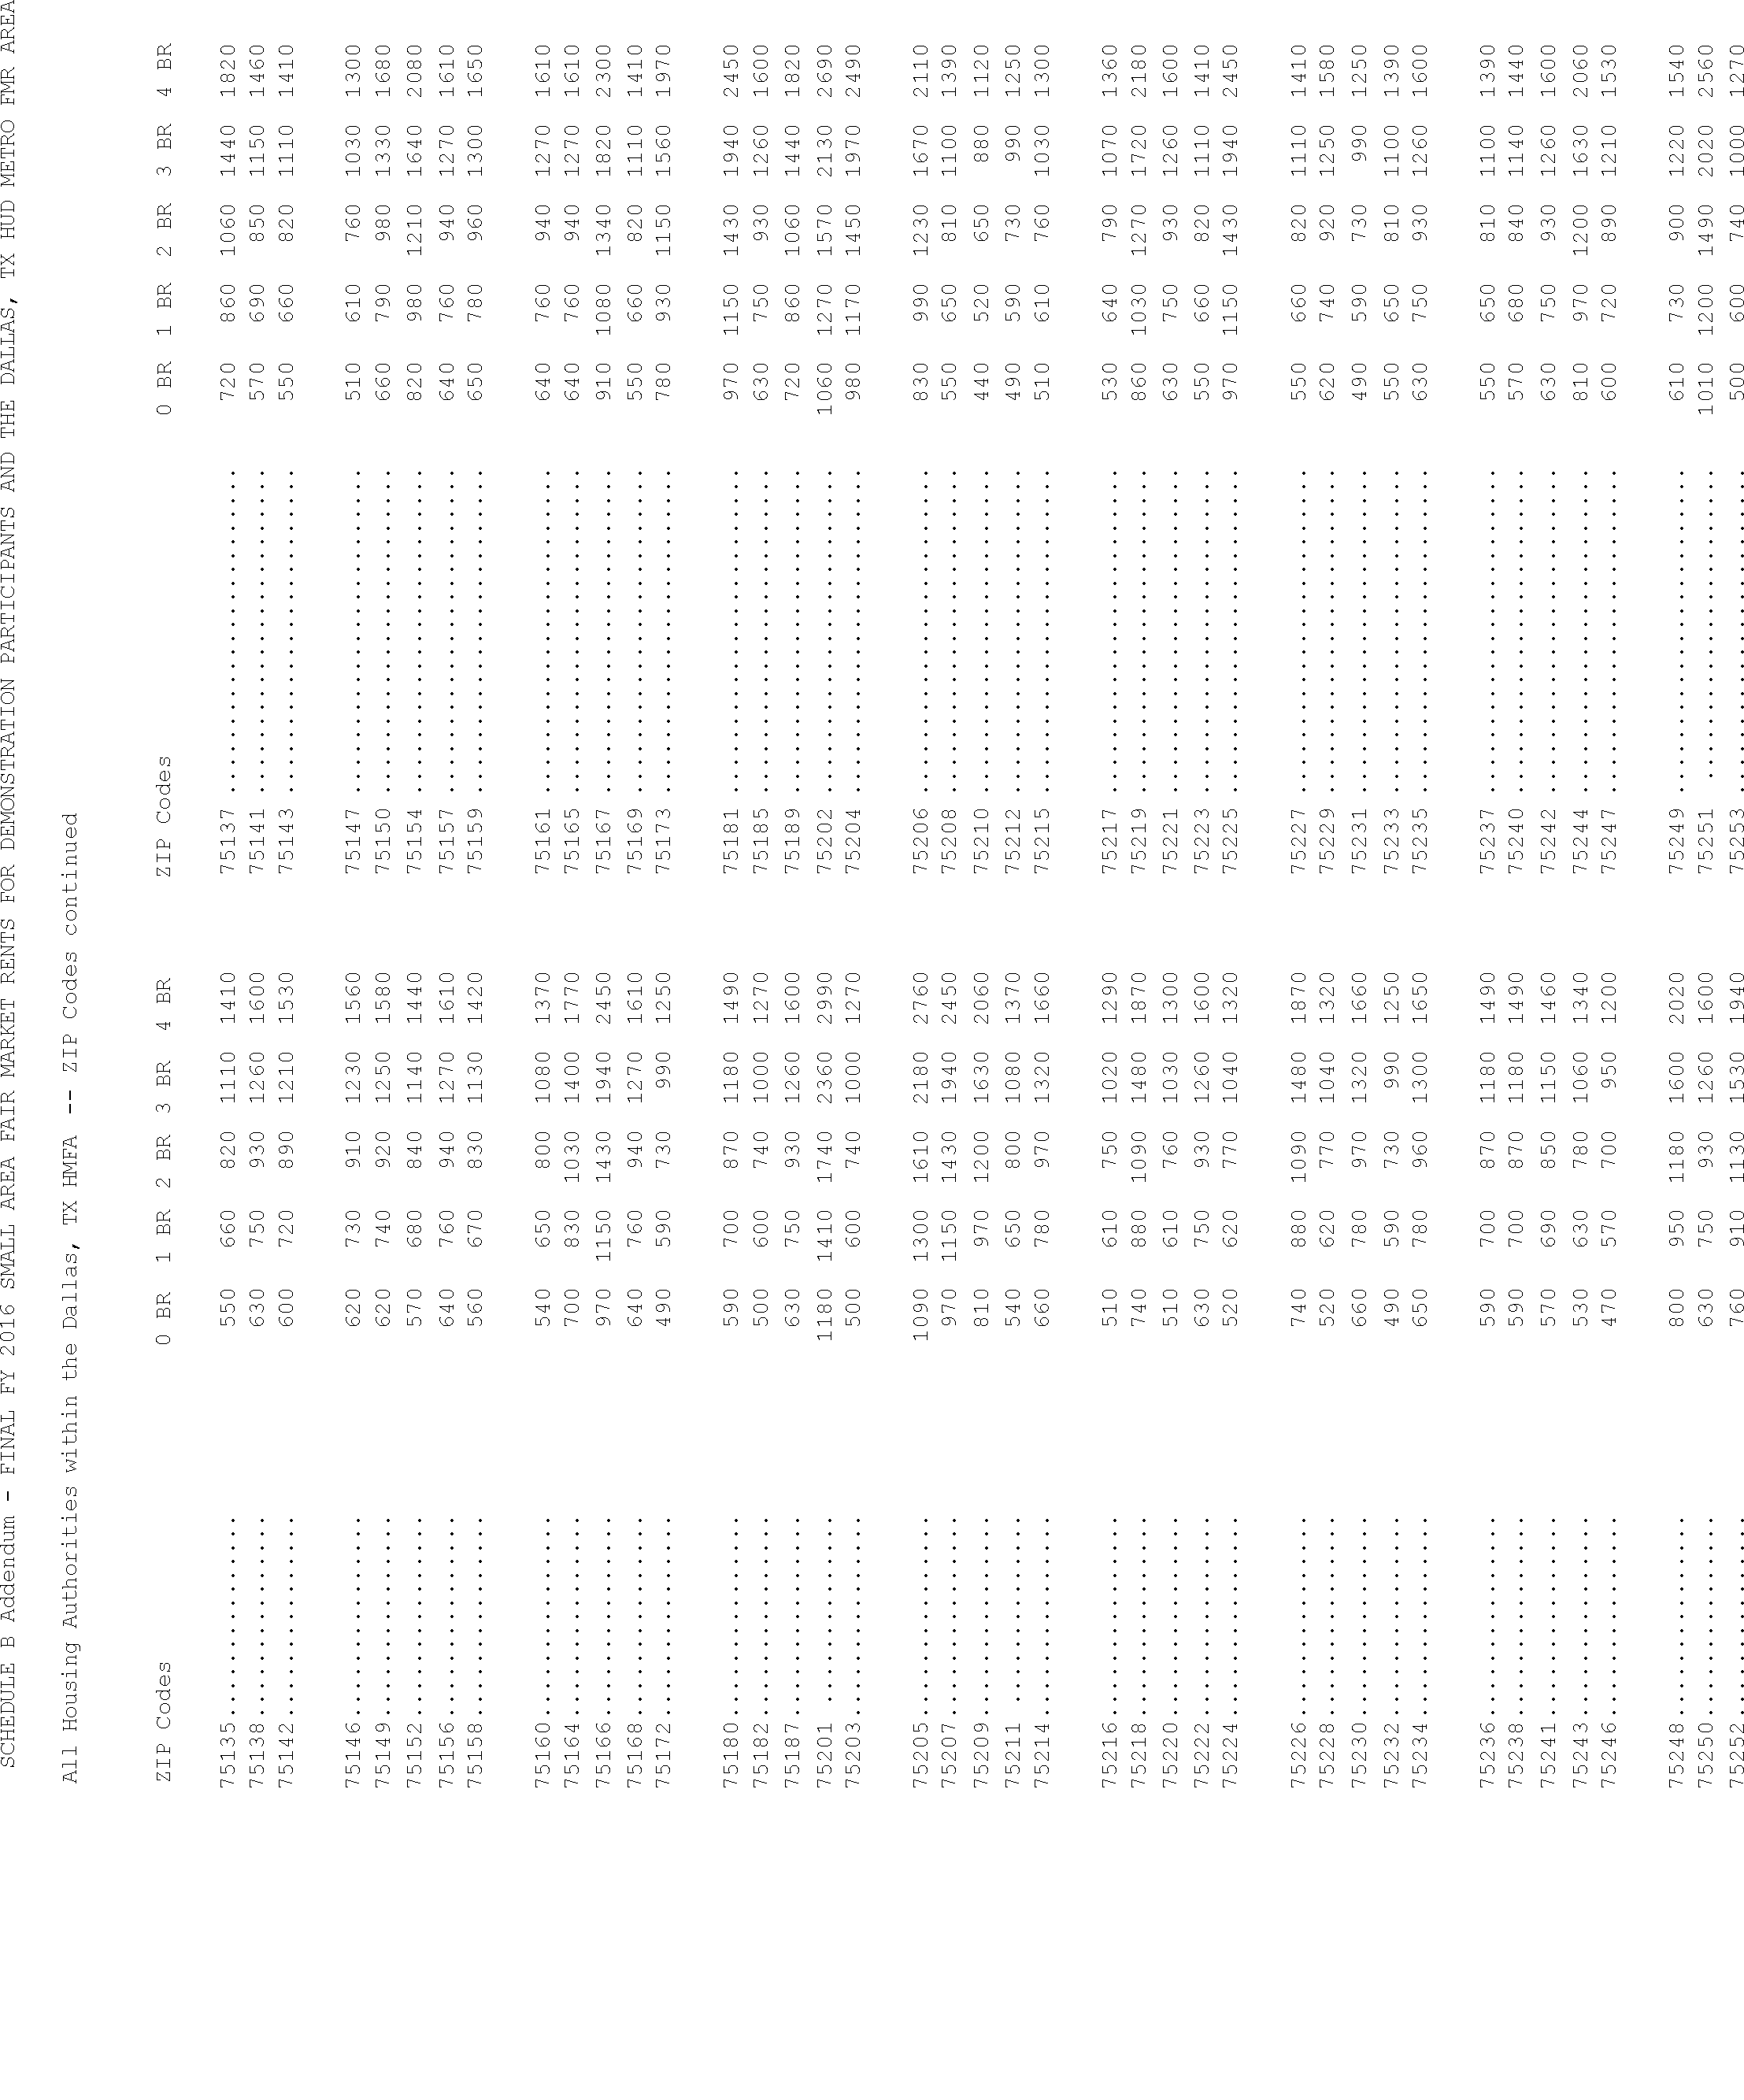
Start Printed Page 77192
Start Printed Page 77193
Start Printed Page 77194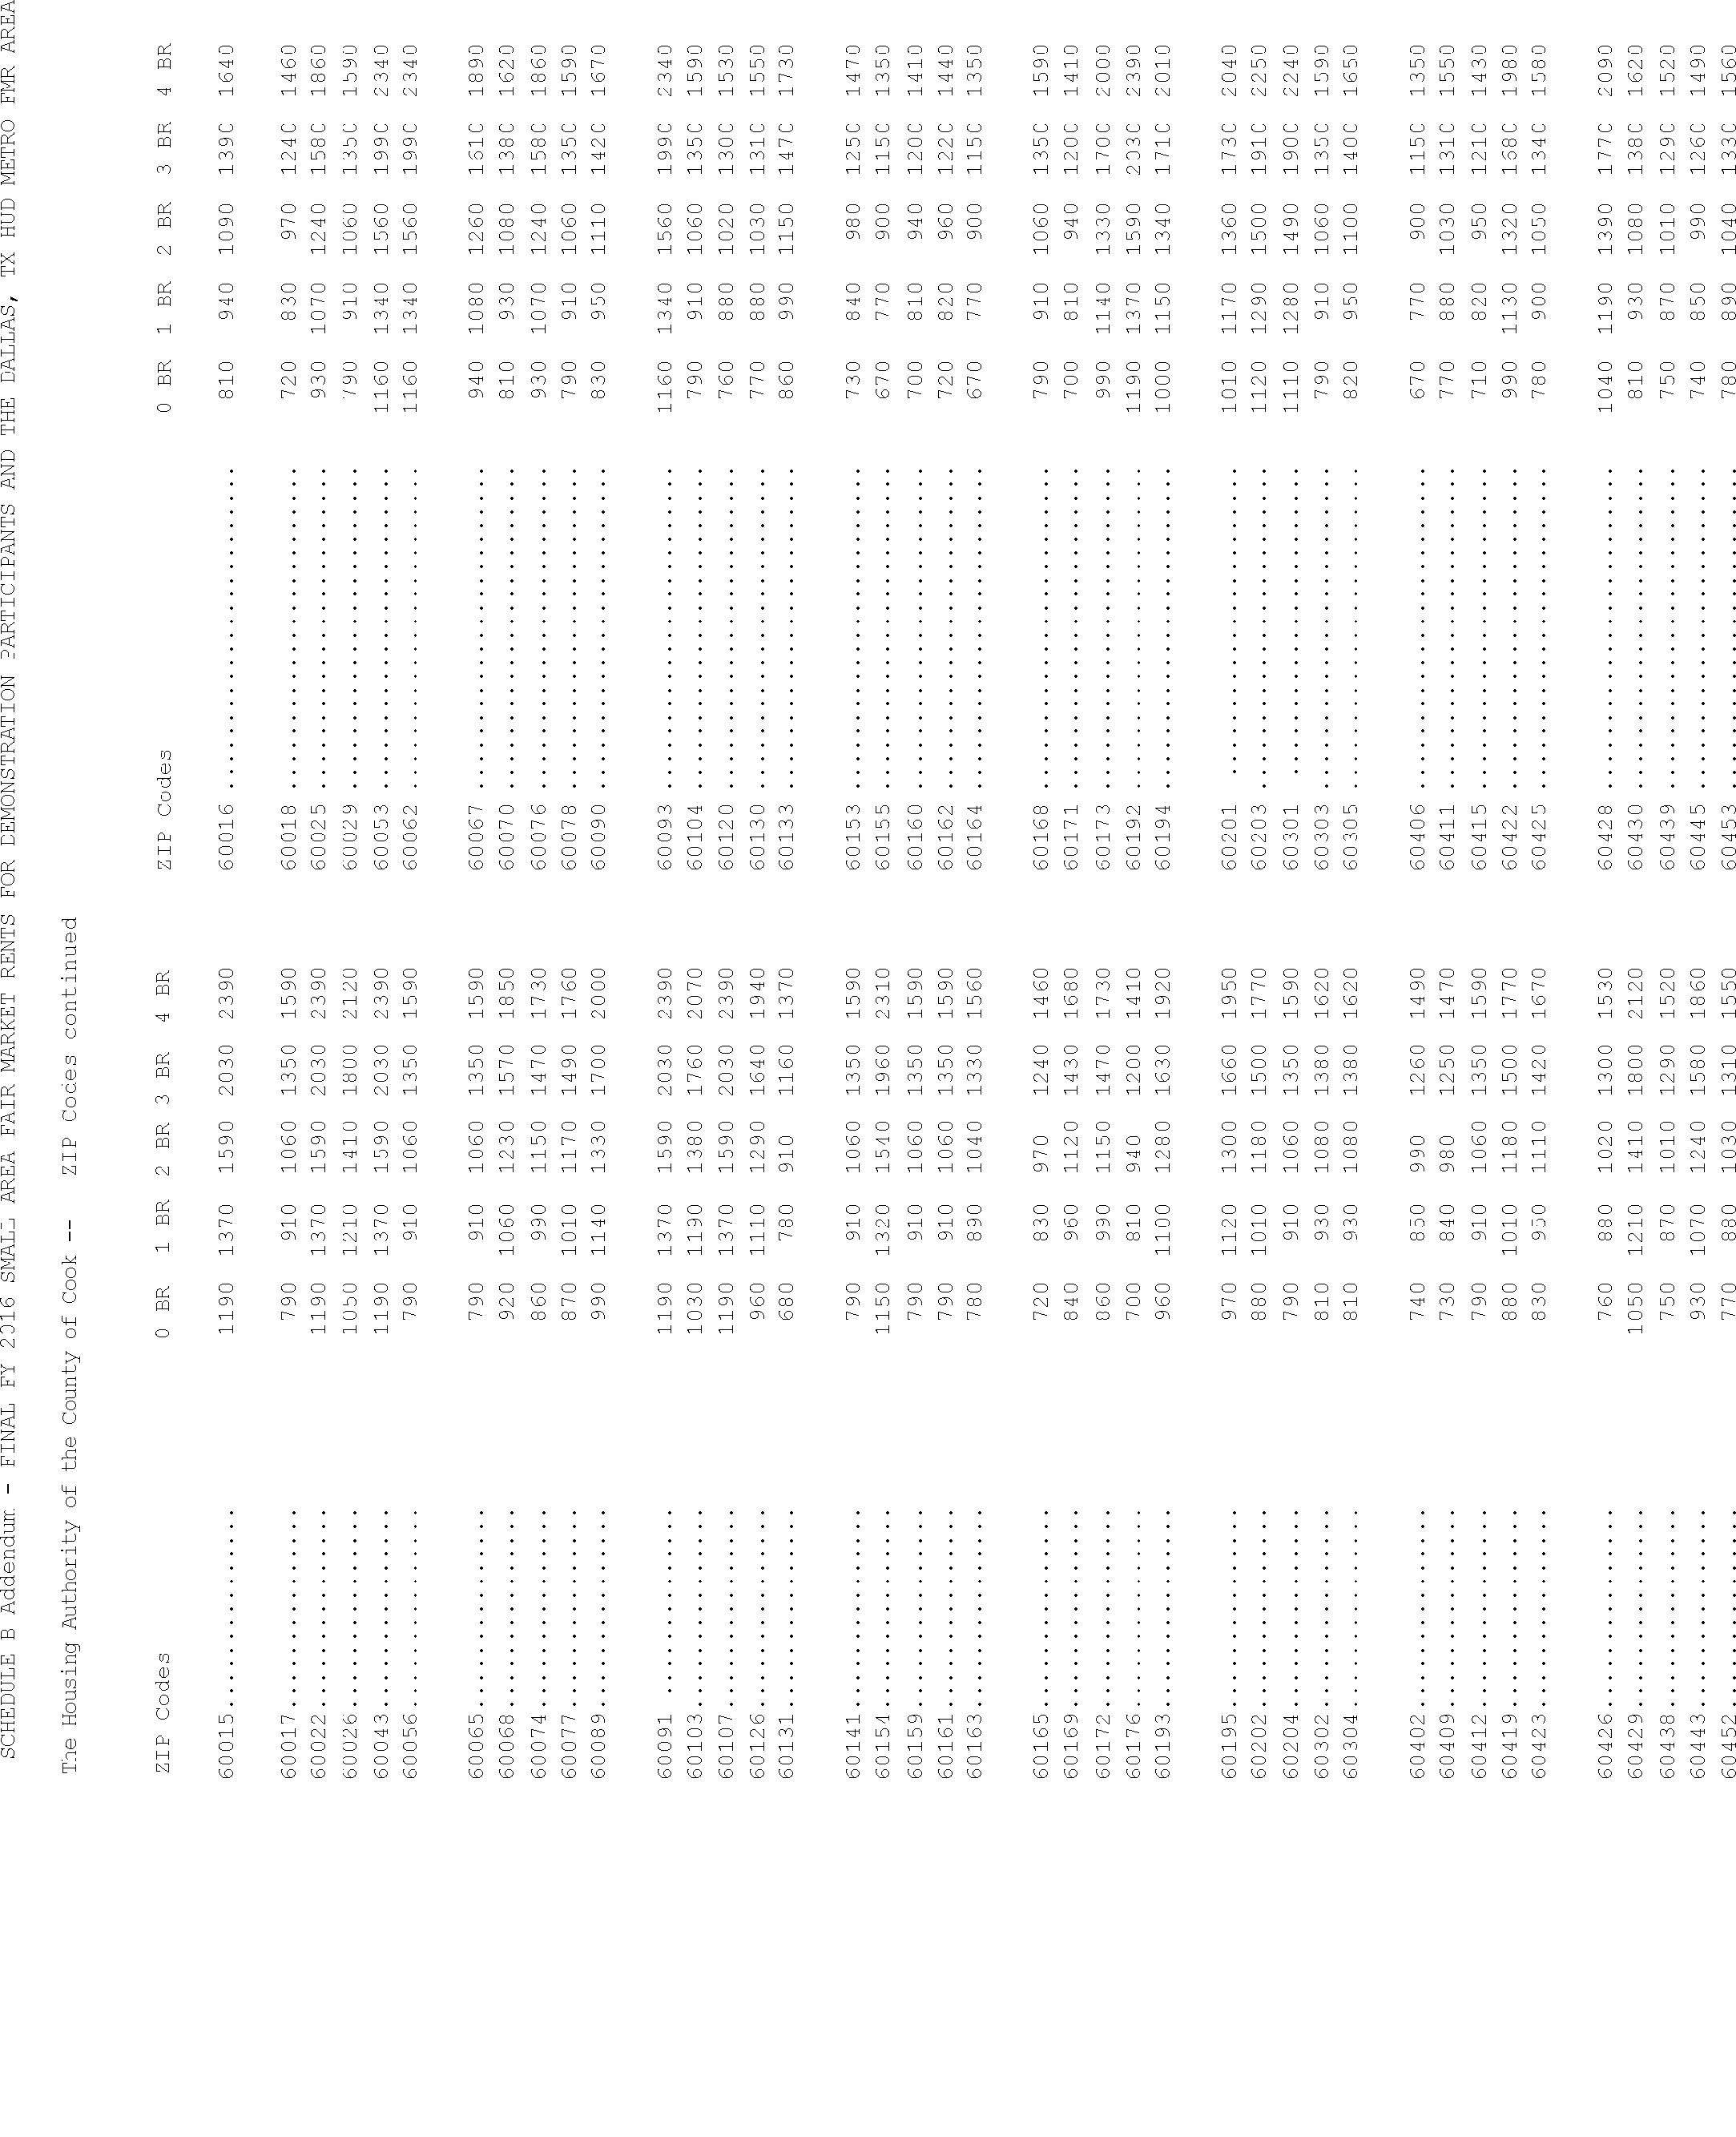
Start Printed Page 77195
Start Printed Page 77196
Start Printed Page 77197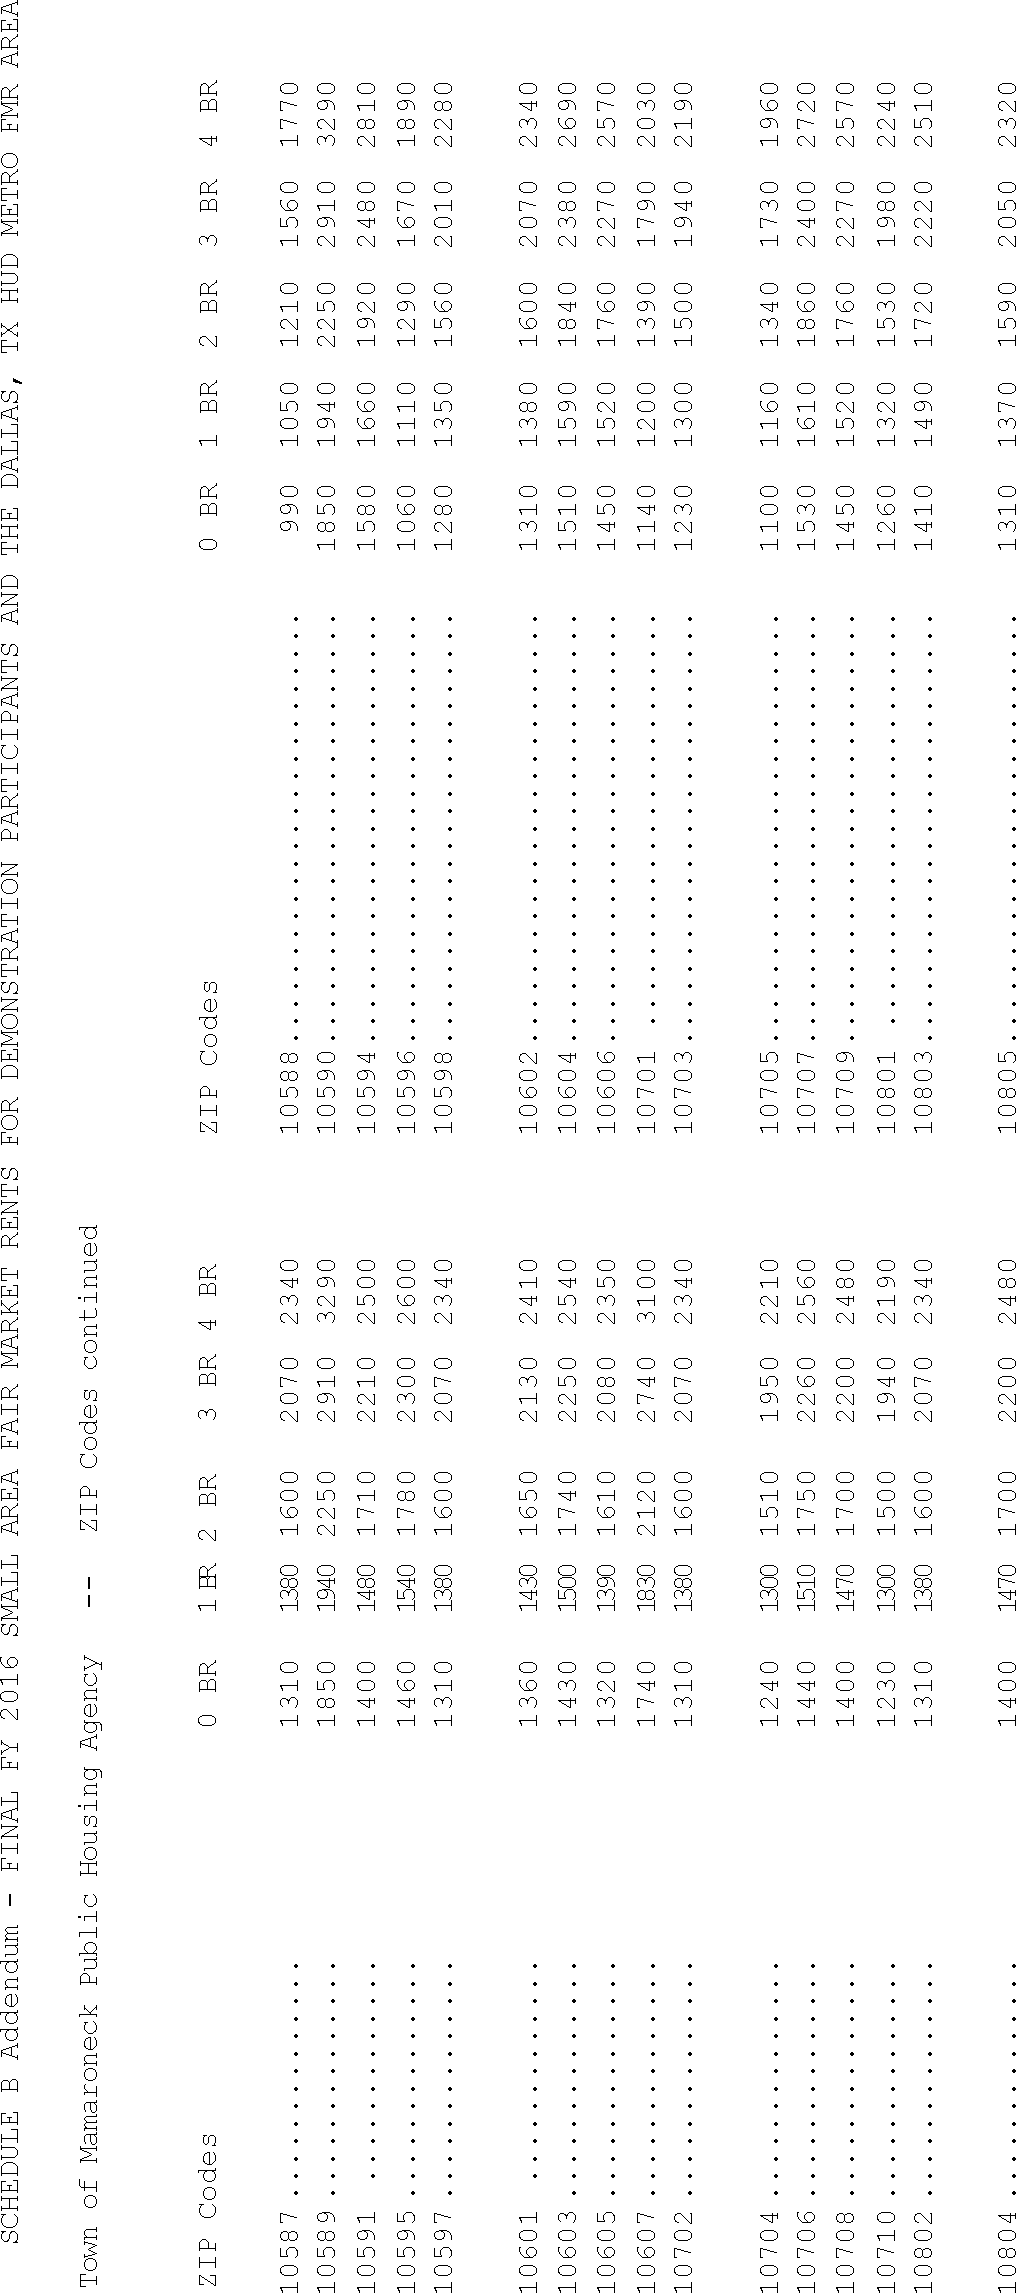 End Supplemental Information
Schedule D—FY 2016 Exception Fair Market Rents for Manufactured Home Spaces in the Section 8 Housing Choice Voucher Program
State Area name Space rent California Los Angeles-Long Beach, CA HMFA $714 Santa Ana-Anaheim-Irvine, CA HMFA 867 * Riverside-San Bernardino-Ontario, CA MSA 565 San Diego-Carlsbad, CA MSA 859 Santa Rosa, CA MSA 814 Vallejo-Fairfield, CA MSA 655 Maryland California-Lexington Park, MD MSA 536 Oregon Bend-Redmond, OR MSA 371 Salem, OR MSA 548 Pennsylvania Gettysburg, PA MSA 589 Washington Olympia-Tumwater, WA MSA 659 Seattle-Bellevue, WA HMFA 728 West Virginia Logan County 485 McDowell County 485 Mercer County 485 Mingo County 485 Wyoming County 485 * 50th percentile FMR area. Footnotes
1. As defined in 24 CFR 888.113(c), a minimally qualified area is an area with at least 100 Census tracts where 70 percent or fewer of the Census tracts with at least 10 two-bedroom rental units are Census tracts in which at least 30 percent of the two bedroom rental units have gross rents at or below the two bedroom FMR set at the 40th percentile rent. This continues to be evaluated with 2000 Decennial Census information. Although the 5-year ACS tract level data is available, HUD plans to implement new 50th percentile areas in conjunction with the implementation of new OMB area definitions.
Back to Citation2. The only difference in survey data between the 2008-2012 5-year ACS data and the 2009-2013 5-year ACS data is the replacement of 2008 survey responses with survey responses collected in 2013. The 2009, 2010, 2011 and 2012 survey responses remain intact; however, the weighting placed on each survey response is updated by the Census Bureau during the process of aggregating the data to be as of the final year of the 5-year period.
Back to Citation3. For areas with a two-bedroom standard quality gross rent from the ACS that have a margin of error greater than half of the estimate or no estimate due to inadequate sample in the 2013 5-year ACS, HUD uses the two-bedroom state non-metro rent for non-metro areas.
Back to Citation4. For the purpose of the recent mover factor calculation, a statistically reliable estimate occurs where the recent mover gross rent has a margin of error that is less than half of the estimate.
Back to Citation5. HUD has provided numerous detailed accounts of the calculation methodology used for Small Area Fair Market Rents. Please see our Federal Register notice of April 20, 2011 (76 FR 22125) for more information regarding the calculation methodology. HUD's Final FY 2016 FMR documentation system available at (http://www.huduser.gov/portal/datasets/fmr/fmrs/docsys.html?data=fmr16) contains detailed calculations for each ZIP code area in participating jurisdictions.
Back to CitationBILLING CODE 4210-67-P
BILLING CODE 4210-67-C
[FR Doc. 2015-31319 Filed 12-10-15; 8:45 am]
BILLING CODE 4210-67-P


Document Information
- Published:
- 12/11/2015
- Department:
- Housing and Urban Development Department
- Entry Type:
- Notice
- Action:
- Notice of Final Fiscal Year (FY) 2016 Fair Market Rents (FMRs).
- Document Number:
- 2015-31319
- Pages:
- 77123-77197 (75 pages)
- Docket Numbers:
- Docket No. FR-5885-N-02
- PDF File:
- 2015-31319.pdf